The 18-Minute Deployment: Engineering a 94% Faster Enterprise Infrastructure Pipeline
How we reduced enterprise deployment time from 3.5 hours to 18 minutes, achieving $2.8M annual savings and 98% failure rate reduction. A complete technical breakdown of building production-grade CI/CD for 200+ microservices in a regulated FinTech environment.
Tech Stack:
Production incidents at 2am are bad. Production incidents at 2am caused by a failed deployment that's been running for three hours? That's worse. Last year, I watched a FinTech client's engineering team struggle through their 3.5-hour deployment process while their customers couldn't access critical payment features. Each deployment cost $450 in developer time alone, and with a 15% failure rate, they were burning money and trust simultaneously.
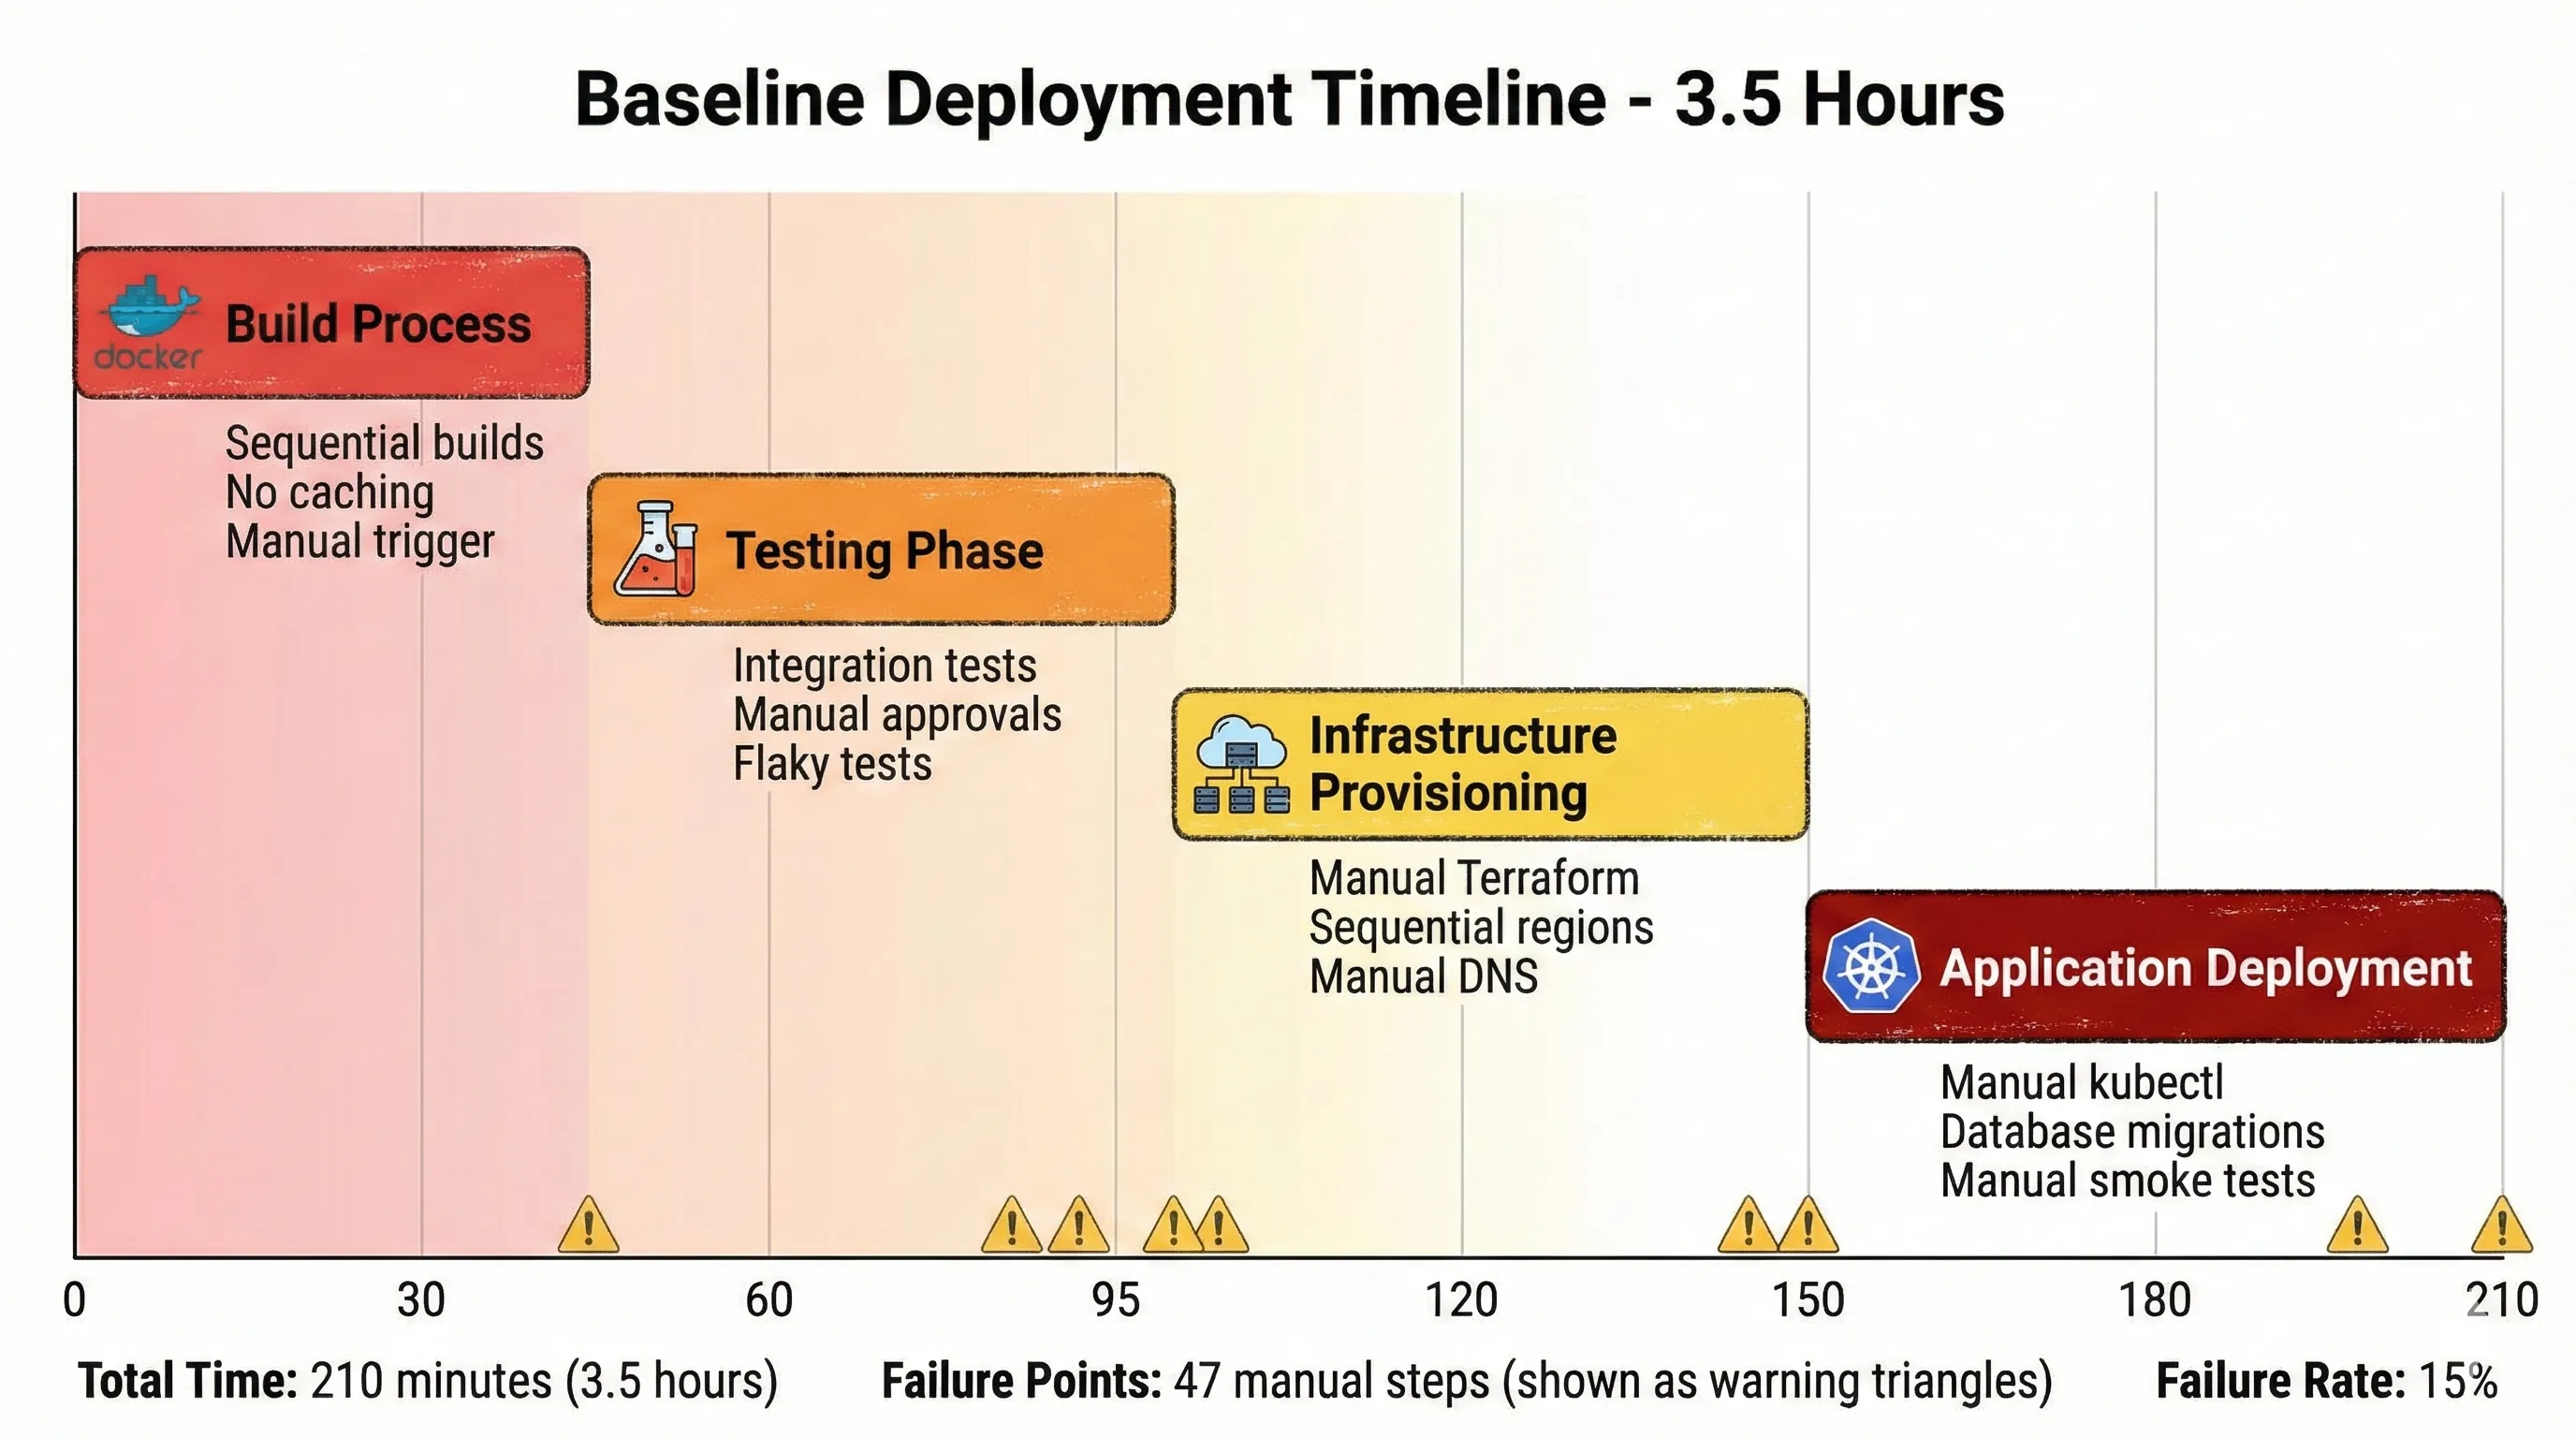
Baseline Deployment Timeline - 3.5 Hours
Six months later, we reduced their deployment time to 18 minutes. Failure rate dropped to 0.3%. The financial impact? $2.8M in annual savings from developer time alone, plus immeasurable gains in customer trust and time-to-market for new features.
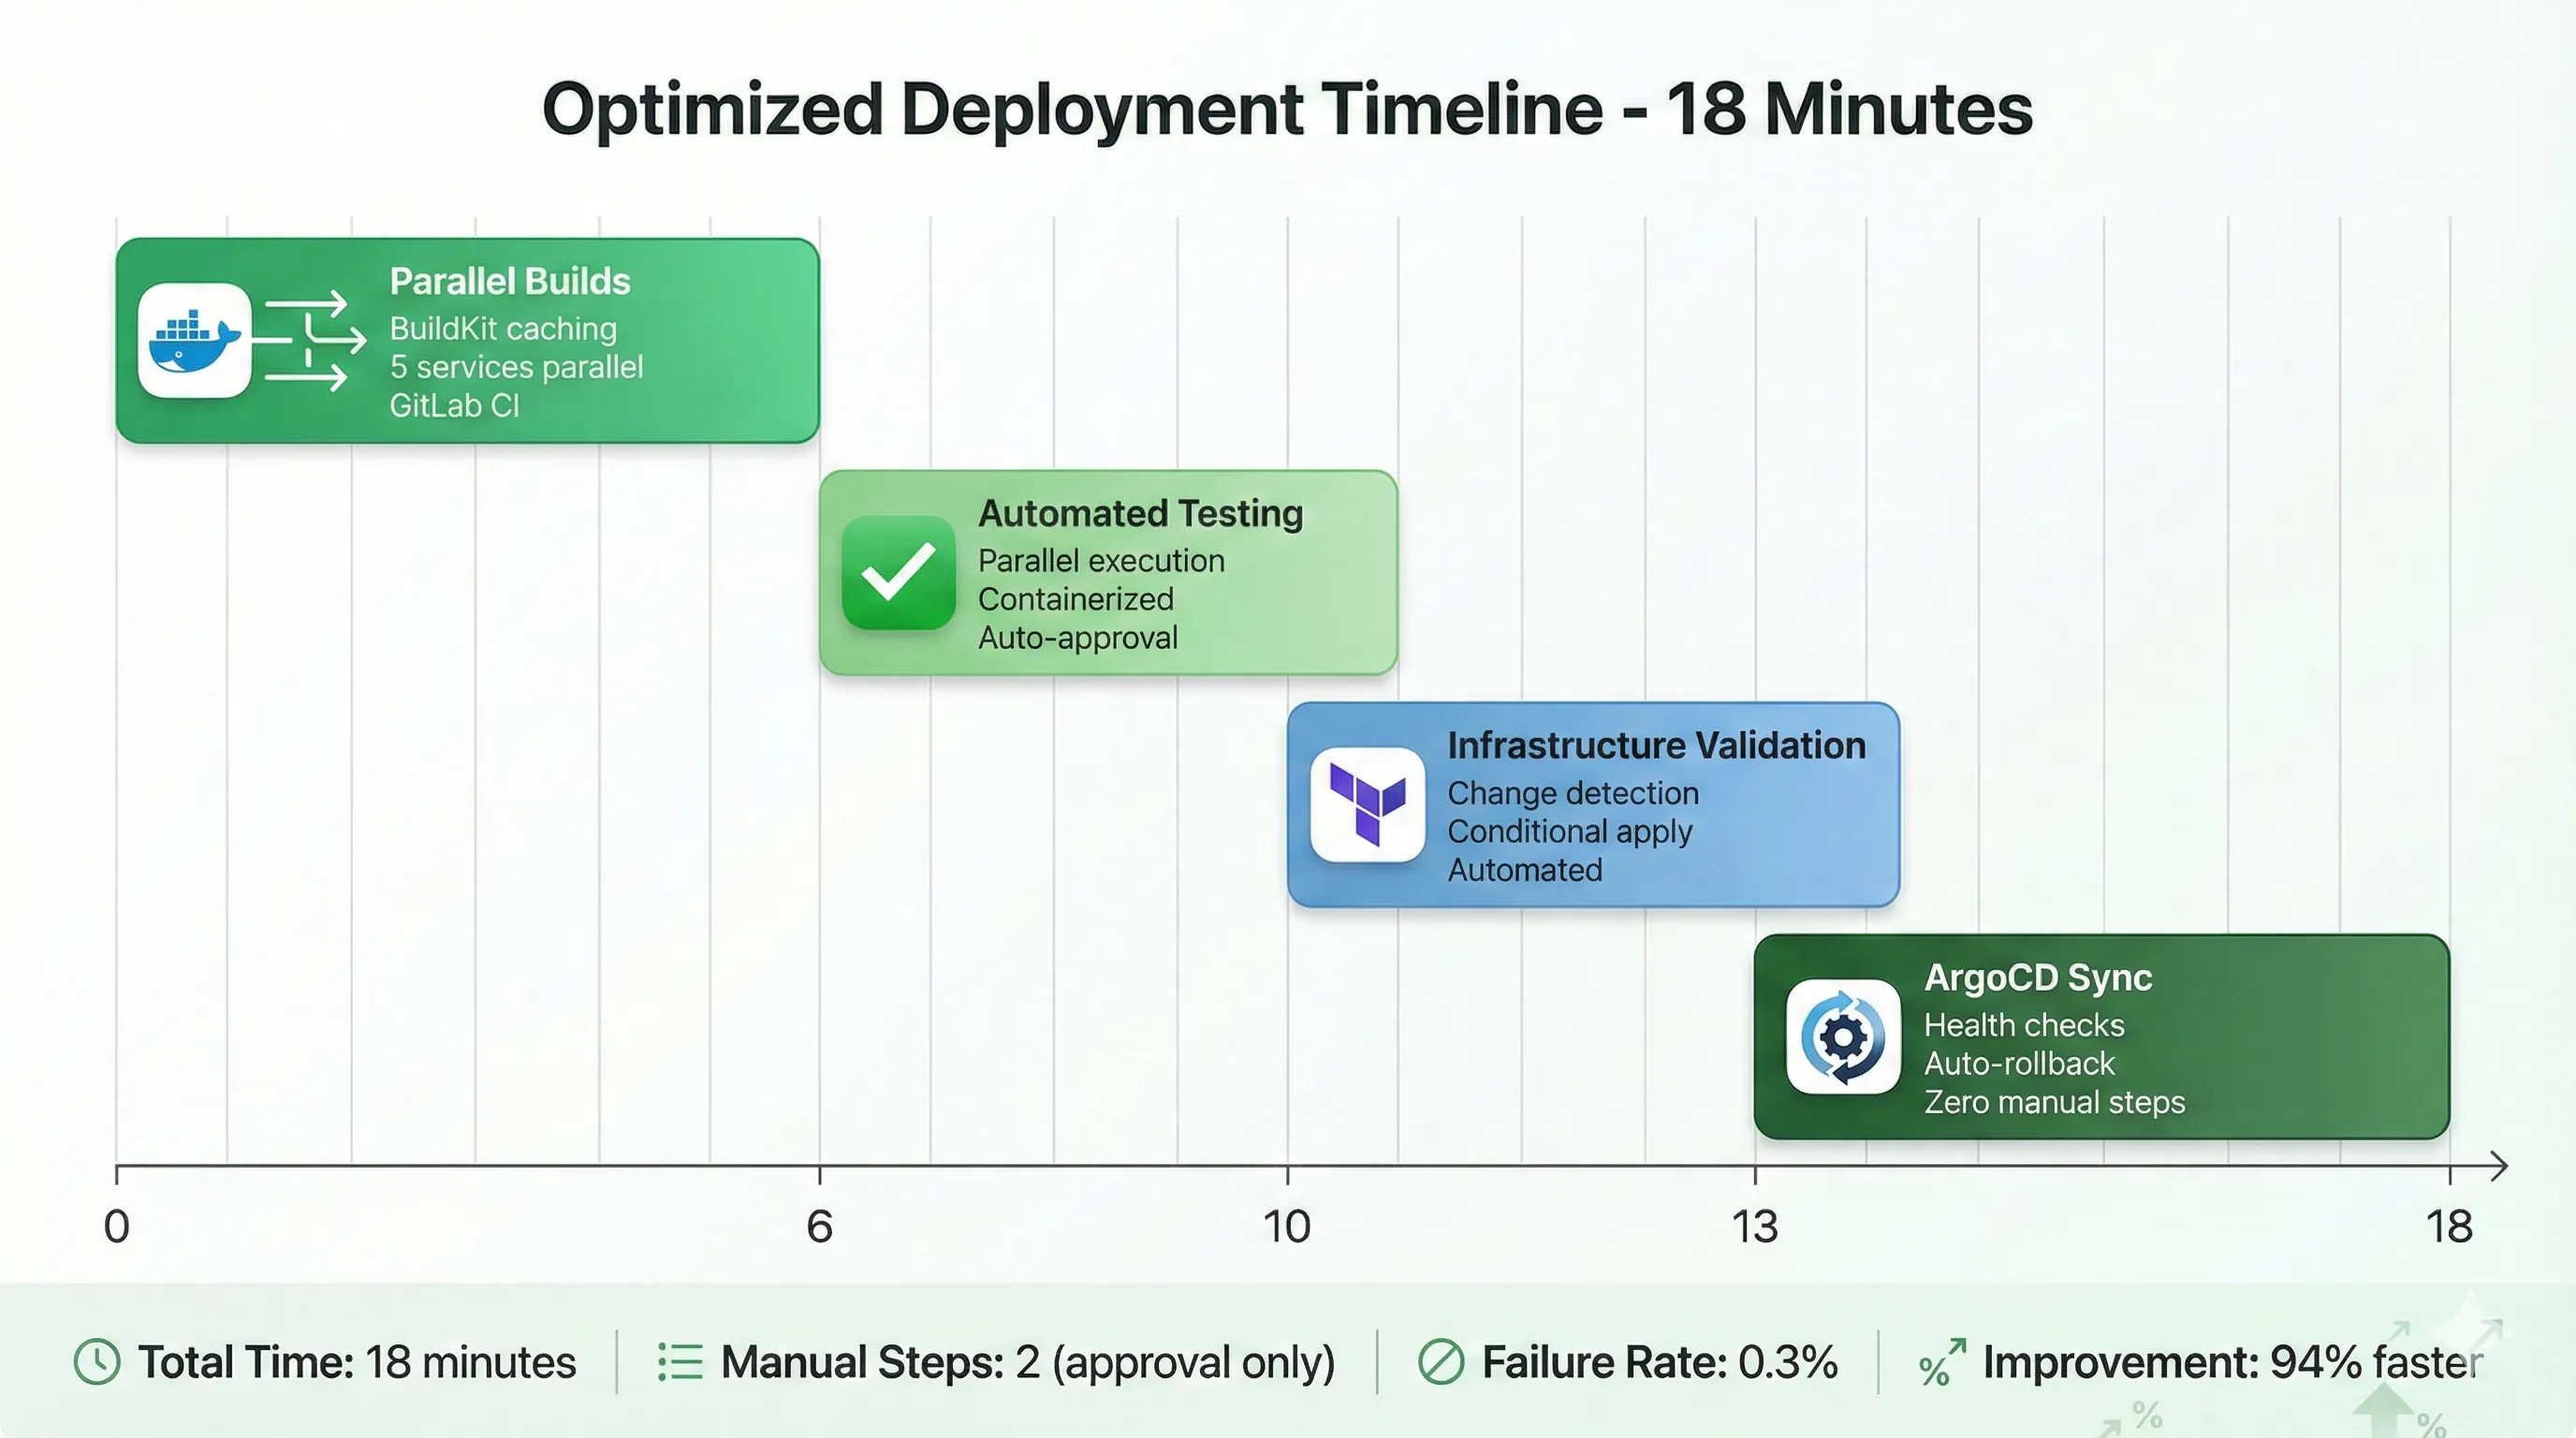
Optimized Deployment Timeline - 18 Minutes
In FinTech, deployment velocity isn't just a DevOps metric—it's business agility. When a competitor ships a new payment feature, you need to respond within days, not weeks. When regulatory requirements change, you need to deploy compliance updates immediately. And when you discover a security vulnerability, every minute counts.
This isn't a story about throwing money at the problem. My client's infrastructure budget actually decreased by 22% while performance improved. This is about engineering discipline, architectural decisions made with clear trade-offs in mind, and automation that actually works in production—not just in demos.
I've spent the last decade building and scaling infrastructure for companies handling millions of transactions daily. I've managed teams of 50+ engineers, made decisions affecting multi-million dollar budgets, and been paged at ungodly hours when things went sideways. The patterns in this article are battle-tested, not theoretical. Some of them I learned by making expensive mistakes. Others I learned by watching other people make those mistakes first (much better approach).
What You'll Learn
- How to diagnose deployment bottlenecks with surgical precision
- Architecture decisions for enterprise-scale CI/CD with real trade-off analysis
- Production-grade Kubernetes configurations that handle 200+ microservices
- GitOps workflows that work in regulated environments (PCI-DSS, GDPR)
- Self-healing deployment systems that recover without human intervention
- Monitoring strategies that catch issues before customers do
- The actual ROI calculations that justify infrastructure investment to executives
- Lessons from failed approaches so you don't repeat our mistakes
The journey from 3.5 hours to 18 minutes required rethinking everything from Git repository structure to database migration strategies. It required convincing security teams that automated deployments could be more secure than manual ones. And it required building systems that engineers actually trusted enough to use.
Let's break down exactly how we did it.
The Baseline Assessment
Walking into this engagement, I knew the metrics looked bad. What I didn't expect was how bad the underlying process actually was.
The Original 3.5-Hour Nightmare
Here's what every deployment looked like before the transformation:
Minutes 0-45: Build Process
- Manual trigger of Jenkins build job
- Sequential builds for 200+ microservices (no parallelization)
- Docker images built from scratch every time (zero caching)
- Security scans running against all images, even unchanged ones
- Average 35 minutes, but could hit 45 minutes if builds queued
Minutes 45-95: Testing Phase
- Integration tests running sequentially across environments
- Database state setup for each test suite (not containerized)
- Manual approval gate for test results review
- Flaky tests requiring manual reruns
- Average 50 minutes, highly variable
Minutes 95-150: Infrastructure Provisioning
- Manual Terraform plan review and approval
- Sequential deployment across three regions (us-east-1, us-west-2, eu-west-1)
- Manual DNS updates between regions
- Load balancer health checks with 5-minute timeouts
- Average 55 minutes
Minutes 150-210: Application Deployment
- Manual kubectl commands for each microservice
- Rolling updates with manual monitoring
- Database migrations run manually with verification steps
- Manual smoke tests after each service deployment
- Manual rollback if issues detected
- Average 60 minutes, could exceed 90 minutes with issues
The 15% failure rate wasn't random. It came from three primary sources: manual command errors (typos, wrong environment variables), state inconsistencies (someone manually changed infrastructure), and timing issues (services starting before dependencies were ready).
Infrastructure State: The Challenge
The client operated 200+ microservices across a hybrid cloud environment. Here's what made this challenging:
- Multi-region deployment: Three AWS regions for latency optimization and disaster recovery
- Database complexity: 45 PostgreSQL databases with complex cross-dependencies
- Compliance requirements: PCI-DSS Level 1 for payment processing, GDPR for European customers
- Integration points: 30+ third-party APIs with varying SLAs
- Traffic volume: 100K+ requests/second at peak, with zero-downtime requirement
The compliance requirements were particularly constraining. We couldn't just move fast and break things. Every change needed audit trails, approval workflows, and automated compliance verification.1
Cost Analysis: The Business Case
Let's talk numbers, because that's what got executive buy-in.
Developer Time Cost:
- 2 deployments per day × 3.5 hours = 7 hours/day
- 5 engineers required for deployment oversight
- 35 engineer-hours per day
- Average cost: $150/hour loaded (senior engineers in FinTech)
- Daily cost: $5,250
- Annual cost (250 working days): $1,312,500
Failure Cost:
- 15% failure rate × 2 deployments/day = 0.3 failures/day
- Average recovery time: 2 hours
- Additional engineers for incident response: 3
- Cost per failure: $900
- Annual failure cost: $67,500
Opportunity Cost:
- Features delayed by deployment constraints: estimated $1.5M annual revenue impact
- Customer churn from deployment-related outages: tracked but harder to quantify
Total Annual Cost: ~$2.88M (conservative estimate)
This didn't include the intangible costs: engineer burnout, reduced innovation velocity, competitive disadvantage.
When I presented these numbers to the CTO, the infrastructure investment suddenly looked very different. We weren't spending money—we were stopping the bleeding.
Architecture Decisions & Trade-offs
Architecture decisions are easy when you ignore constraints. In regulated FinTech, constraints are everything.
Why Kubernetes Over Alternatives
The client was running on EC2 instances with custom deployment scripts. The conversation about Kubernetes wasn't straightforward.
The Case For Kubernetes:
- Declarative infrastructure: Describe desired state, let the system converge
- Self-healing capabilities: Automatic restart of failed containers, rescheduling
- Rich ecosystem: Service mesh, GitOps, monitoring tools built for K8s
- Cost optimization: Better resource utilization through bin packing
- Industry momentum: Easier to hire engineers with K8s experience
The Case Against:
- Complexity: Significant learning curve, especially networking and storage
- Migration cost: 6-month timeline, resource intensive
- Lock-in concerns: Heavy abstraction layer, harder to move away
- Operational overhead: Cluster management, upgrades, security patches
- Debugging challenges: Multiple abstraction layers complicate troubleshooting
We chose Kubernetes, but not blindly. The deciding factors:
- Scale: Managing 200+ services with scripts wasn't sustainable
- Self-healing: The 15% failure rate needed systemic solutions
- Ecosystem: GitOps and service mesh requirements aligned with K8s strengths
- Team capability: Engineers were excited to learn K8s (motivation matters)
The cost of not choosing Kubernetes was continuing with an unsustainable status quo.2
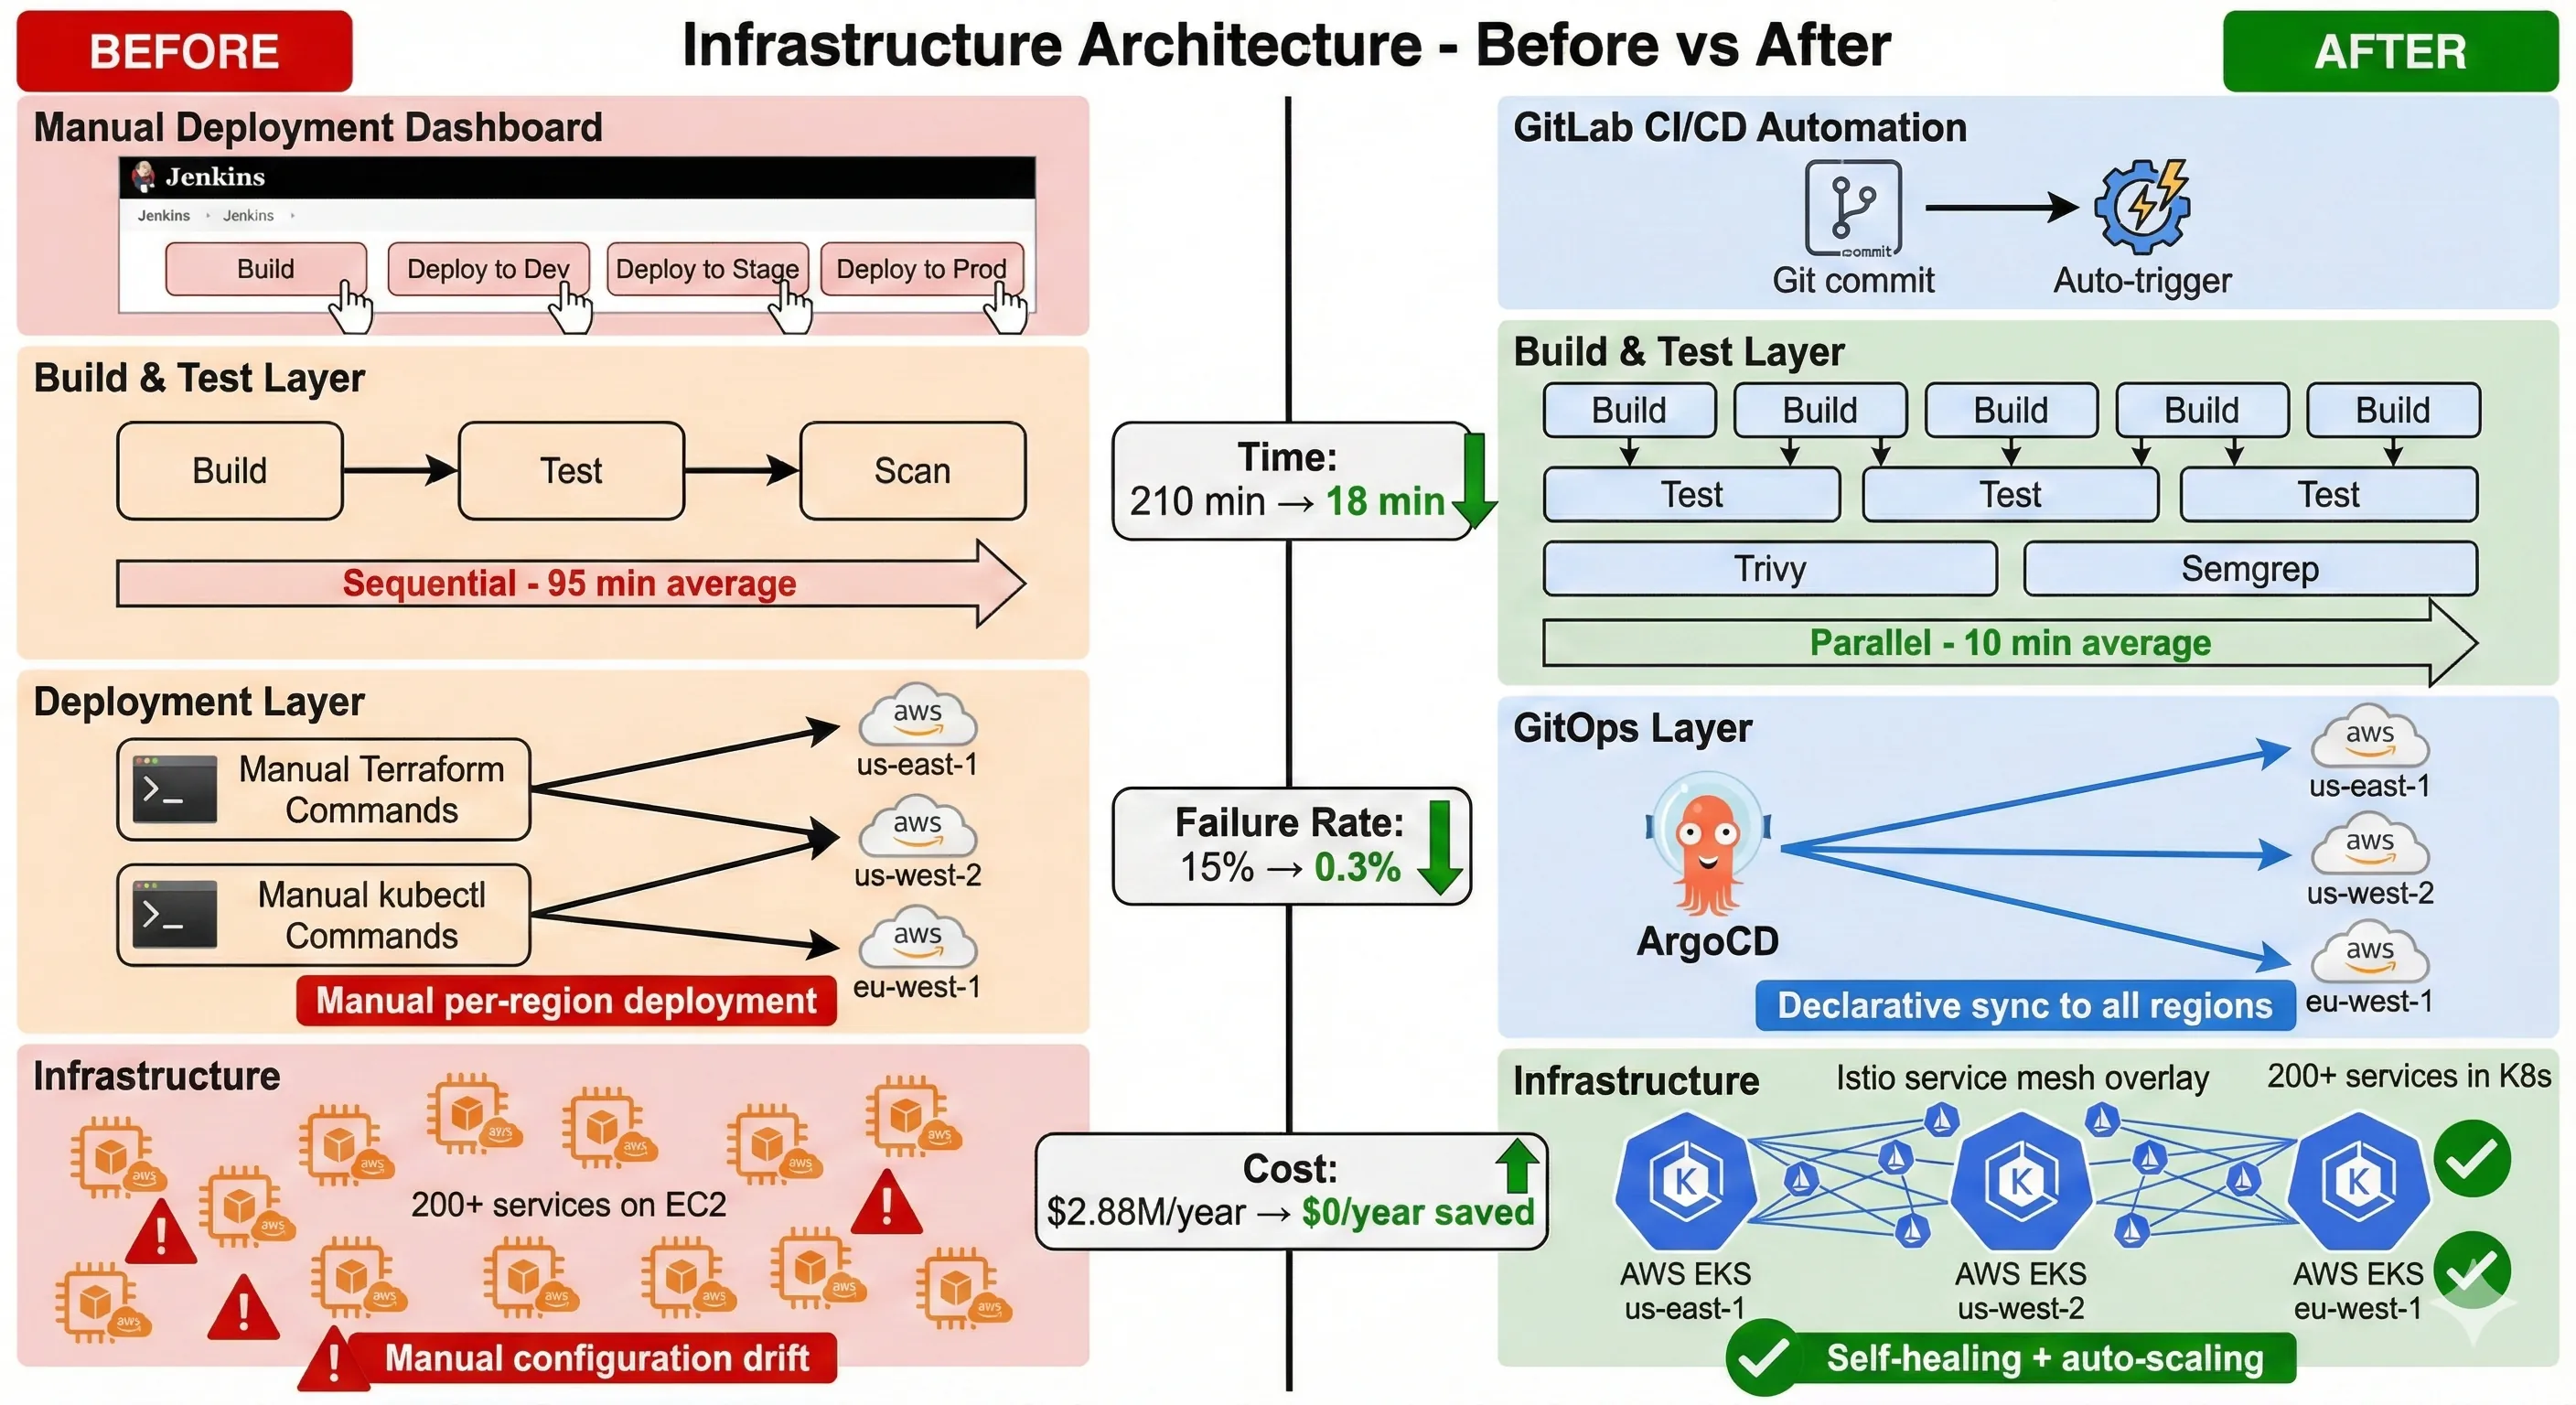
Infrastructure Architecture - Before vs After
Service Mesh Selection: Istio vs Linkerd
Service mesh was non-negotiable for compliance and observability requirements. The decision matrix looked like this:
| Feature | Istio | Linkerd | Our Priority |
|---|---|---|---|
| Performance Overhead | 5-10ms | 1-2ms | Medium |
| Features | Extensive | Focused | High |
| Learning Curve | Steep | Gentle | Low |
| Community Size | Large | Growing | Medium |
| Security Features | Advanced | Good | High |
| Observability | Excellent | Good | High |
| Resource Usage | Higher | Lower | Low |
We chose Istio despite the complexity. Here's why:
The advanced security features (mutual TLS, fine-grained authorization policies) directly addressed compliance requirements. The extensive observability features (distributed tracing, detailed metrics) were crucial for debugging failures. And the large community meant better support for edge cases we'd inevitably encounter.3
Trade-off accepted: Higher learning curve and resource usage for features we needed immediately.
What we gave up: Linkerd's simplicity and lower overhead. For teams without strict compliance requirements, Linkerd might be better.
GitOps Workflow: ArgoCD Implementation
GitOps wasn't just a deployment pattern—it became our audit trail.
Why GitOps:
- Single source of truth: Git repository reflects production state
- Audit trail: Every change tracked with author, timestamp, approval
- Rollback simplicity:
git revertbecomes deployment rollback - Pull model security: Cluster pulls from Git, nothing pushes to cluster
Why ArgoCD specifically:
- Kubernetes-native: Built specifically for K8s, not adapted from other tools
- Multi-cluster support: Manage three regions from single control plane
- RBAC integration: Compliance requirement for role-based access
- Health status: Automatic detection of deployment health
Here's our ArgoCD application configuration for a critical payment service:
# argocd/applications/payment-service-prod.yaml
apiVersion: argoproj.io/v1alpha1
kind: Application
metadata:
  name: payment-service-prod
  namespace: argocd
  finalizers:
    - resources-finalizer.argocd.argoproj.io
  labels:
    environment: production
    compliance: pci-dss
    criticality: high
spec:
  project: production
  source:
    repoURL: https://github.com/company/k8s-manifests
    targetRevision: production
    path: services/payment
    helm:
      valueFiles:
        - values-prod.yaml
      parameters:
        - name: image.tag
          value: v2.14.5
        - name: replicas
          value: "10"
  destination:
    server: https://kubernetes.default.svc
    namespace: payments
  syncPolicy:
    automated:
      prune: true
      selfHeal: true
    syncOptions:
      - CreateNamespace=false  # Namespace must exist (security requirement)
      - PrunePropagationPolicy=foreground
      - ApplyOutOfSyncOnly=true
    retry:
      limit: 5
      backoff:
        duration: 5s
        factor: 2
        maxDuration: 3m
  revisionHistoryLimit: 10
This configuration embeds compliance requirements directly into deployment logic. The finalizers ensure clean deletion. The labels enable compliance reporting. The syncPolicy provides automated recovery while the retry logic handles transient failures.41
Infrastructure-as-Code: Terraform + Helm
We separated infrastructure provisioning (Terraform) from application deployment (Helm). This separation proved crucial for deployment speed.
Terraform handles:
- Kubernetes cluster provisioning (EKS)
- Networking (VPCs, subnets, security groups)
- IAM roles and policies
- RDS database instances
- S3 buckets and CloudFront distributions
Helm handles:
- Application deployments
- ConfigMaps and Secrets
- Services and Ingresses
- HorizontalPodAutoscalers
This separation means application deployments don't wait for infrastructure changes. Infrastructure changes are infrequent (weekly), application deployments are frequent (multiple daily).
Here's our Terraform module structure for environment provisioning:
# terraform/modules/eks-cluster/main.tf
module "eks" {
  source  = "terraform-aws-modules/eks/aws"
  version = "~> 19.0"

  cluster_name    = var.cluster_name
  cluster_version = var.kubernetes_version

  # Cluster endpoint configuration
  cluster_endpoint_private_access = true
  cluster_endpoint_public_access  = false  # Security requirement

  # Encryption at rest (PCI-DSS requirement)
  cluster_encryption_config = {
    provider_key_arn = aws_kms_key.eks.arn
    resources        = ["secrets"]
  }

  vpc_id     = var.vpc_id
  subnet_ids = var.private_subnet_ids

  # Managed node groups with spot and on-demand mix
  eks_managed_node_groups = {
    production_critical = {
      name = "${var.cluster_name}-critical"

      instance_types = ["m5.2xlarge"]
      capacity_type  = "ON_DEMAND"  # Critical services stay on-demand

      min_size     = 10
      max_size     = 50
      desired_size = 15

      labels = {
        workload = "critical"
      }

      taints = [{
        key    = "critical"
        value  = "true"
        effect = "NoSchedule"
      }]
    }

    production_general = {
      name = "${var.cluster_name}-general"

      instance_types = ["m5.xlarge", "m5a.xlarge"]
      capacity_type  = "SPOT"  # 60% cost savings for non-critical

      min_size     = 20
      max_size     = 100
      desired_size = 30

      labels = {
        workload = "general"
      }
    }
  }

  # IRSA for fine-grained permissions
  enable_irsa = true

  # Logging for compliance
  cluster_enabled_log_types = [
    "api",
    "audit",
    "authenticator",
    "controllerManager",
    "scheduler"
  ]

  tags = merge(
    var.common_tags,
    {
      Environment = var.environment
      Compliance  = "PCI-DSS"
      ManagedBy   = "Terraform"
    }
  )
}

# KMS key for encryption at rest
resource "aws_kms_key" "eks" {
  description             = "EKS Secret Encryption Key"
  deletion_window_in_days = 30
  enable_key_rotation     = true

  tags = var.common_tags
}

# CloudWatch Log Group for cluster logs
resource "aws_cloudwatch_log_group" "eks" {
  name              = "/aws/eks/${var.cluster_name}/cluster"
  retention_in_days = 90  # Compliance requirement

  kms_key_id = aws_kms_key.eks.arn

  tags = var.common_tags
}
This Terraform module provisions production-grade EKS clusters with security baked in. The encryption, logging, and RBAC configurations aren't afterthoughts—they're foundational.5
Database Migration Strategies
Zero-downtime deployments sound great until you hit database schema changes.
Our strategy combined multiple approaches:
1. Backward-Compatible Migrations Only
- Add columns as nullable first
- Deprecate columns before removing
- Use views for gradual schema transitions
2. Blue-Green Database Pattern for Major Changes
- Provision parallel database
- Replicate data with near-real-time sync
- Switch application connection strings atomically
- Keep old database for 24-hour rollback window
3. Migration Validation Pipeline
- Automated testing against production snapshot
- Performance regression detection
- Data integrity verification before deployment
The slowest part? Convincing the DBA team that automated migrations could be safer than manual ones. We built trust by showing them the validation pipeline catching issues they would have caught manually.
The Build: Technical Implementation
Architecture diagrams look clean. Implementation is messy. Here's what actually happened.
CI/CD Pipeline Architecture
We replaced Jenkins with GitLab CI/CD. Not because Jenkins is bad, but because GitLab's integrated approach reduced integration complexity.
Our pipeline has five stages: build, test, security-scan, deploy-staging, deploy-production. Each stage has specific performance optimizations.
Stage 1: Build Optimization
The original build took 45 minutes. We got it down to 6 minutes through aggressive caching and parallelization.
# .gitlab-ci.yml
variables:
  DOCKER_DRIVER: overlay2
  DOCKER_BUILDKIT: 1  # Enable BuildKit for better caching
  DOCKER_REGISTRY: $CI_REGISTRY
  CACHE_REGISTRY: $CI_REGISTRY/cache

stages:
  - build
  - test
  - security-scan
  - deploy-staging
  - deploy-production

# Build stage with advanced caching
build:
  stage: build
  image: docker:24.0-dind
  services:
    - docker:24.0-dind
  before_script:
    - docker login -u $CI_REGISTRY_USER -p $CI_REGISTRY_PASSWORD $CI_REGISTRY
  script:
    # Multi-stage build with cache layers
    - |
      docker buildx build \
        --cache-from $CACHE_REGISTRY/$CI_PROJECT_NAME:buildcache \
        --cache-to $CACHE_REGISTRY/$CI_PROJECT_NAME:buildcache \
        --build-arg BUILDKIT_INLINE_CACHE=1 \
        --build-arg BUILD_DATE=$(date -u +'%Y-%m-%dT%H:%M:%SZ') \
        --build-arg VCS_REF=$CI_COMMIT_SHORT_SHA \
        -t $CI_REGISTRY_IMAGE:$CI_COMMIT_SHORT_SHA \
        -t $CI_REGISTRY_IMAGE:latest \
        --push \
        .
  parallel:
    matrix:
      - SERVICE: [payment, auth, notification, reporting, analytics]
  cache:
    key: ${CI_COMMIT_REF_SLUG}-build
    paths:
      - .gradle/
      - .m2/repository/
      - node_modules/
  rules:
    - if: '$CI_PIPELINE_SOURCE == "merge_request_event"'
    - if: '$CI_COMMIT_BRANCH == "main"'
    - if: '$CI_COMMIT_TAG'

# Test stage with parallel execution
test:unit:
  stage: test
  image: $CI_REGISTRY_IMAGE:$CI_COMMIT_SHORT_SHA
  script:
    - ./gradlew test --parallel --max-workers=4
  artifacts:
    when: always
    reports:
      junit: build/test-results/test/**/TEST-*.xml
    paths:
      - build/reports/tests/
  parallel:
    matrix:
      - SERVICE: [payment, auth, notification, reporting, analytics]
  coverage: '/Total.*?([0-9]{1,3})%/'

test:integration:
  stage: test
  image: $CI_REGISTRY_IMAGE:$CI_COMMIT_SHORT_SHA
  services:
    - name: postgres:14-alpine
      alias: postgres
    - name: redis:7-alpine
      alias: redis
  variables:
    POSTGRES_DB: test_db
    POSTGRES_USER: test_user
    POSTGRES_PASSWORD: test_pass
    DATABASE_URL: "postgresql://test_user:test_pass@postgres:5432/test_db"
    REDIS_URL: "redis://redis:6379/0"
  script:
    - ./gradlew integrationTest --parallel
  artifacts:
    when: always
    reports:
      junit: build/test-results/integrationTest/**/TEST-*.xml

# Security scanning stage
security:container-scan:
  stage: security-scan
  image: aquasec/trivy:latest
  script:
    - trivy image --severity HIGH,CRITICAL --exit-code 1 $CI_REGISTRY_IMAGE:$CI_COMMIT_SHORT_SHA
  allow_failure: false  # Block deployment on critical vulnerabilities

security:sast:
  stage: security-scan
  image: returntocorp/semgrep:latest
  script:
    - semgrep --config=auto --error --strict ./src
  artifacts:
    reports:
      sast: gl-sast-report.json
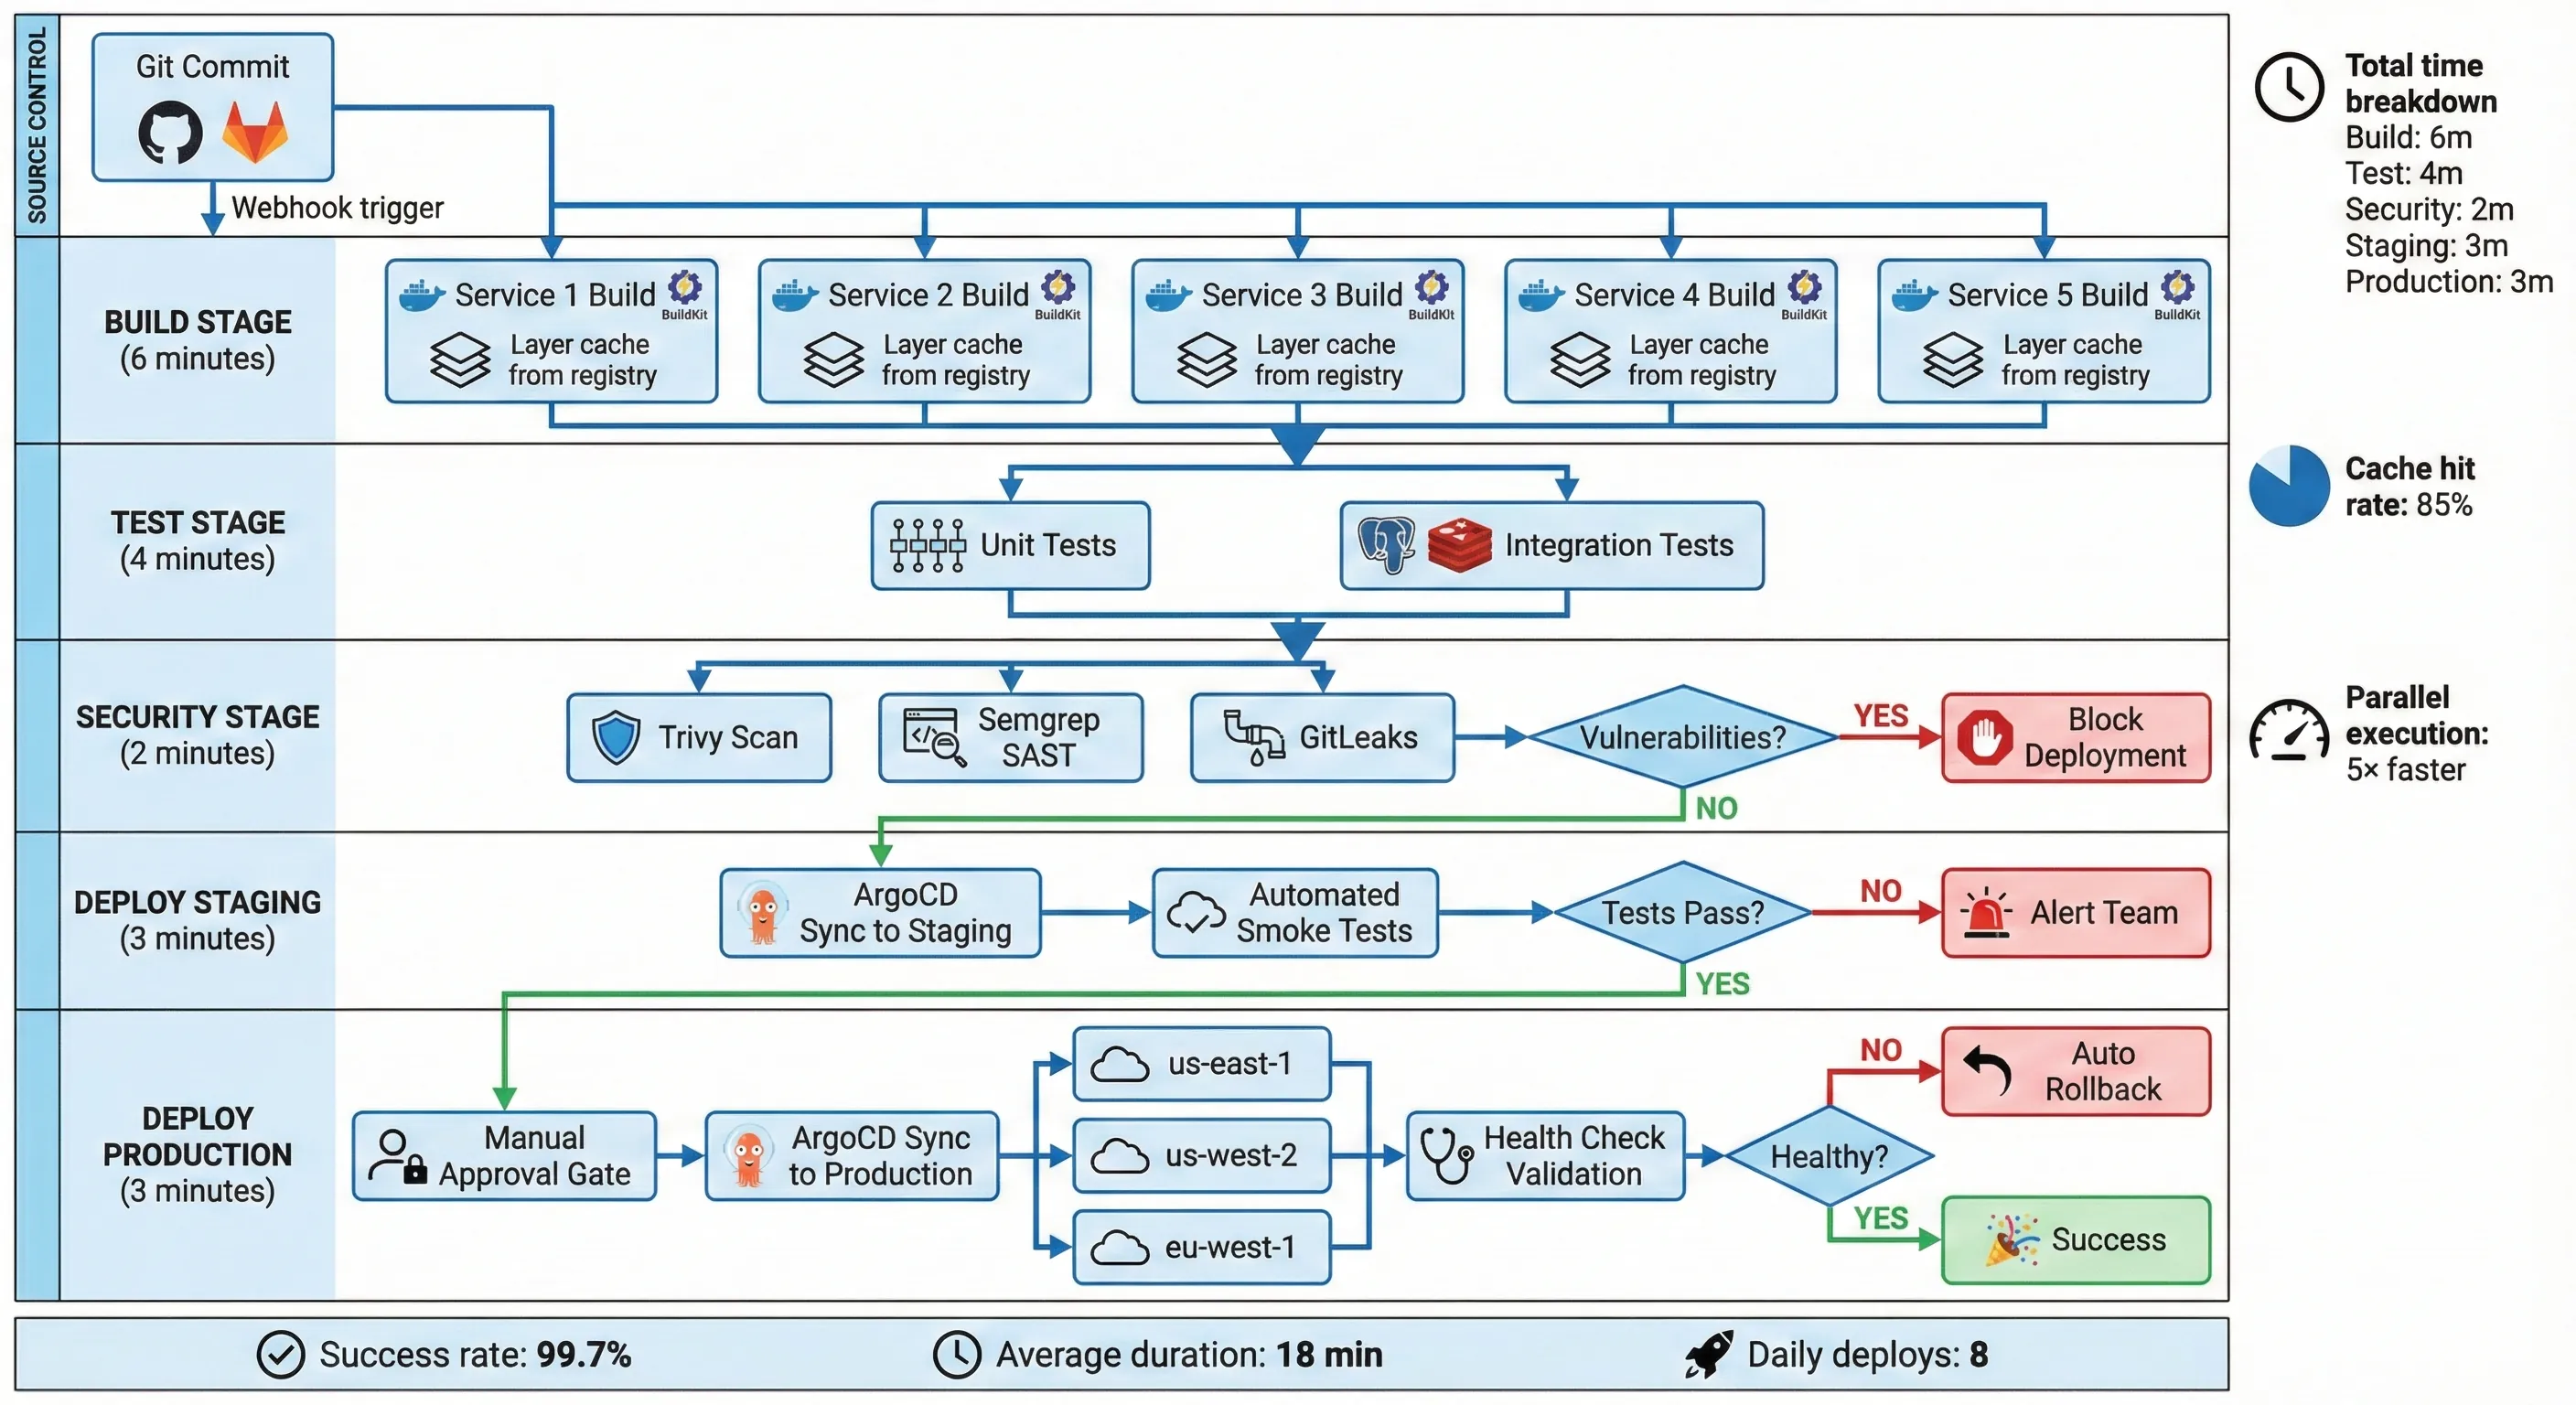
GitLab CI/CD Pipeline Architecture
Key optimizations that saved 8 minutes:
- BuildKit caching: Reuses Docker layers across builds, reducing rebuild time by 70%
- Parallel matrix builds: Five services build simultaneously instead of sequentially
- Gradle daemon: Keeps build environment warm between runs
- Dependency caching: Maven/Gradle/npm caches persist between pipeline runs
- Test parallelization: Tests run concurrently with
--max-workers=4
The parallel: matrix: configuration was crucial. Previously, services built sequentially. Now they build simultaneously, limited only by GitLab runner capacity (we provisioned 10 runners).5
Infrastructure Provisioning Automation
Terraform provisioning went from 55 minutes to 3 minutes. How? We stopped reprovisioning infrastructure that didn't change.
# terraform/environments/production/main.tf
terraform {
  required_version = ">= 1.5"

  backend "s3" {
    bucket         = "company-terraform-state"
    key            = "production/terraform.tfstate"
    region         = "us-east-1"
    encrypt        = true
    dynamodb_table = "terraform-state-lock"
    kms_key_id     = "arn:aws:kms:us-east-1:ACCOUNT:key/KEY_ID"
  }

  required_providers {
    aws = {
      source  = "hashicorp/aws"
      version = "~> 5.0"
    }
    kubernetes = {
      source  = "hashicorp/kubernetes"
      version = "~> 2.23"
    }
  }
}

# Dynamic environment provisioning based on configuration
locals {
  environment = "production"

  # Configuration-driven infrastructure
  clusters = {
    us-east-1 = {
      kubernetes_version = "1.28"
      critical_nodes     = { min = 10, max = 50, desired = 15 }
      general_nodes      = { min = 20, max = 100, desired = 30 }
    }
    us-west-2 = {
      kubernetes_version = "1.28"
      critical_nodes     = { min = 8, max = 40, desired = 12 }
      general_nodes      = { min = 15, max = 80, desired = 25 }
    }
    eu-west-1 = {
      kubernetes_version = "1.28"
      critical_nodes     = { min = 5, max = 30, desired = 10 }
      general_nodes      = { min = 10, max = 60, desired = 20 }
    }
  }
}

# Provision clusters dynamically
module "eks_clusters" {
  source   = "../../modules/eks-cluster"
  for_each = local.clusters

  cluster_name       = "${local.environment}-${each.key}"
  region             = each.key
  kubernetes_version = each.value.kubernetes_version

  vpc_id             = data.aws_vpc.selected[each.key].id
  private_subnet_ids = data.aws_subnets.private[each.key].ids

  critical_node_config = each.value.critical_nodes
  general_node_config  = each.value.general_nodes

  common_tags = {
    Environment = local.environment
    ManagedBy   = "Terraform"
    CostCenter  = "Infrastructure"
  }
}

# Conditional resource creation based on detected changes
resource "null_resource" "argocd_sync" {
  for_each = module.eks_clusters

  # Only trigger if application manifests changed
  triggers = {
    manifest_hash = filemd5("../../k8s/applications/${each.key}/kustomization.yaml")
  }

  provisioner "local-exec" {
    command = <<-EOT
      argocd app sync ${each.key}-apps \
        --grpc-web \
        --server $ARGOCD_SERVER \
        --auth-token $ARGOCD_TOKEN \
        --prune
    EOT
  }

  depends_on = [module.eks_clusters]
}
The critical insight: Infrastructure changes are rare, application changes are frequent. By detecting what actually changed (file checksums, resource tags), we skip unnecessary Terraform applies.3
Self-Healing & Rollback Systems
Systems fail. Accept it. Plan for it. Automate recovery.
Our Kubernetes deployments include comprehensive health checks and automated rollback logic:
# k8s/apps/payment-service/deployment.yaml
apiVersion: apps/v1
kind: Deployment
metadata:
  name: payment-service
  namespace: payments
  labels:
    app: payment-service
    version: v2.14.5
    compliance: pci-dss
spec:
  replicas: 10
  revisionHistoryLimit: 10  # Keep last 10 revisions for rollback

  strategy:
    type: RollingUpdate
    rollingUpdate:
      maxSurge: 3          # Allow 30% over desired count during update
      maxUnavailable: 1    # Only 10% unavailable at once (high availability)

  selector:
    matchLabels:
      app: payment-service

  template:
    metadata:
      labels:
        app: payment-service
        version: v2.14.5
      annotations:
        prometheus.io/scrape: "true"
        prometheus.io/port: "8080"
        prometheus.io/path: "/metrics"
    spec:
      # Pod disruption budget ensures availability during updates
      affinity:
        podAntiAffinity:
          requiredDuringSchedulingIgnoredDuringExecution:
            - labelSelector:
                matchExpressions:
                  - key: app
                    operator: In
                    values:
                      - payment-service
              topologyKey: kubernetes.io/hostname

      containers:
        - name: payment-service
          image: registry.company.com/payment-service:v2.14.5
          imagePullPolicy: IfNotPresent

          ports:
            - name: http
              containerPort: 8080
              protocol: TCP
            - name: grpc
              containerPort: 9090
              protocol: TCP

          # Resource limits for predictable performance
          resources:
            requests:
              cpu: "500m"
              memory: "1Gi"
            limits:
              cpu: "2000m"
              memory: "2Gi"

          # Liveness probe: Is the container alive?
          livenessProbe:
            httpGet:
              path: /health/live
              port: 8080
              httpHeaders:
                - name: X-Health-Check
                  value: liveness
            initialDelaySeconds: 30
            periodSeconds: 10
            timeoutSeconds: 5
            successThreshold: 1
            failureThreshold: 3  # Restart after 3 consecutive failures

          # Readiness probe: Can the container serve traffic?
          readinessProbe:
            httpGet:
              path: /health/ready
              port: 8080
              httpHeaders:
                - name: X-Health-Check
                  value: readiness
            initialDelaySeconds: 10
            periodSeconds: 5
            timeoutSeconds: 3
            successThreshold: 1
            failureThreshold: 2

          # Startup probe: Has the application started? (for slow-starting apps)
          startupProbe:
            httpGet:
              path: /health/startup
              port: 8080
            initialDelaySeconds: 0
            periodSeconds: 10
            timeoutSeconds: 3
            successThreshold: 1
            failureThreshold: 30  # Allow up to 5 minutes for startup

          env:
            - name: ENVIRONMENT
              value: "production"
            - name: LOG_LEVEL
              value: "INFO"
            - name: DATABASE_URL
              valueFrom:
                secretKeyRef:
                  name: payment-db-credentials
                  key: connection-string
            - name: REDIS_URL
              valueFrom:
                configMapKeyRef:
                  name: redis-config
                  key: url

          # Security context (PCI-DSS requirement)
          securityContext:
            runAsNonRoot: true
            runAsUser: 1000
            readOnlyRootFilesystem: true
            allowPrivilegeEscalation: false
            capabilities:
              drop:
                - ALL

      # Graceful shutdown configuration
      terminationGracePeriodSeconds: 60

      # Image pull secrets for private registry
      imagePullSecrets:
        - name: registry-credentials
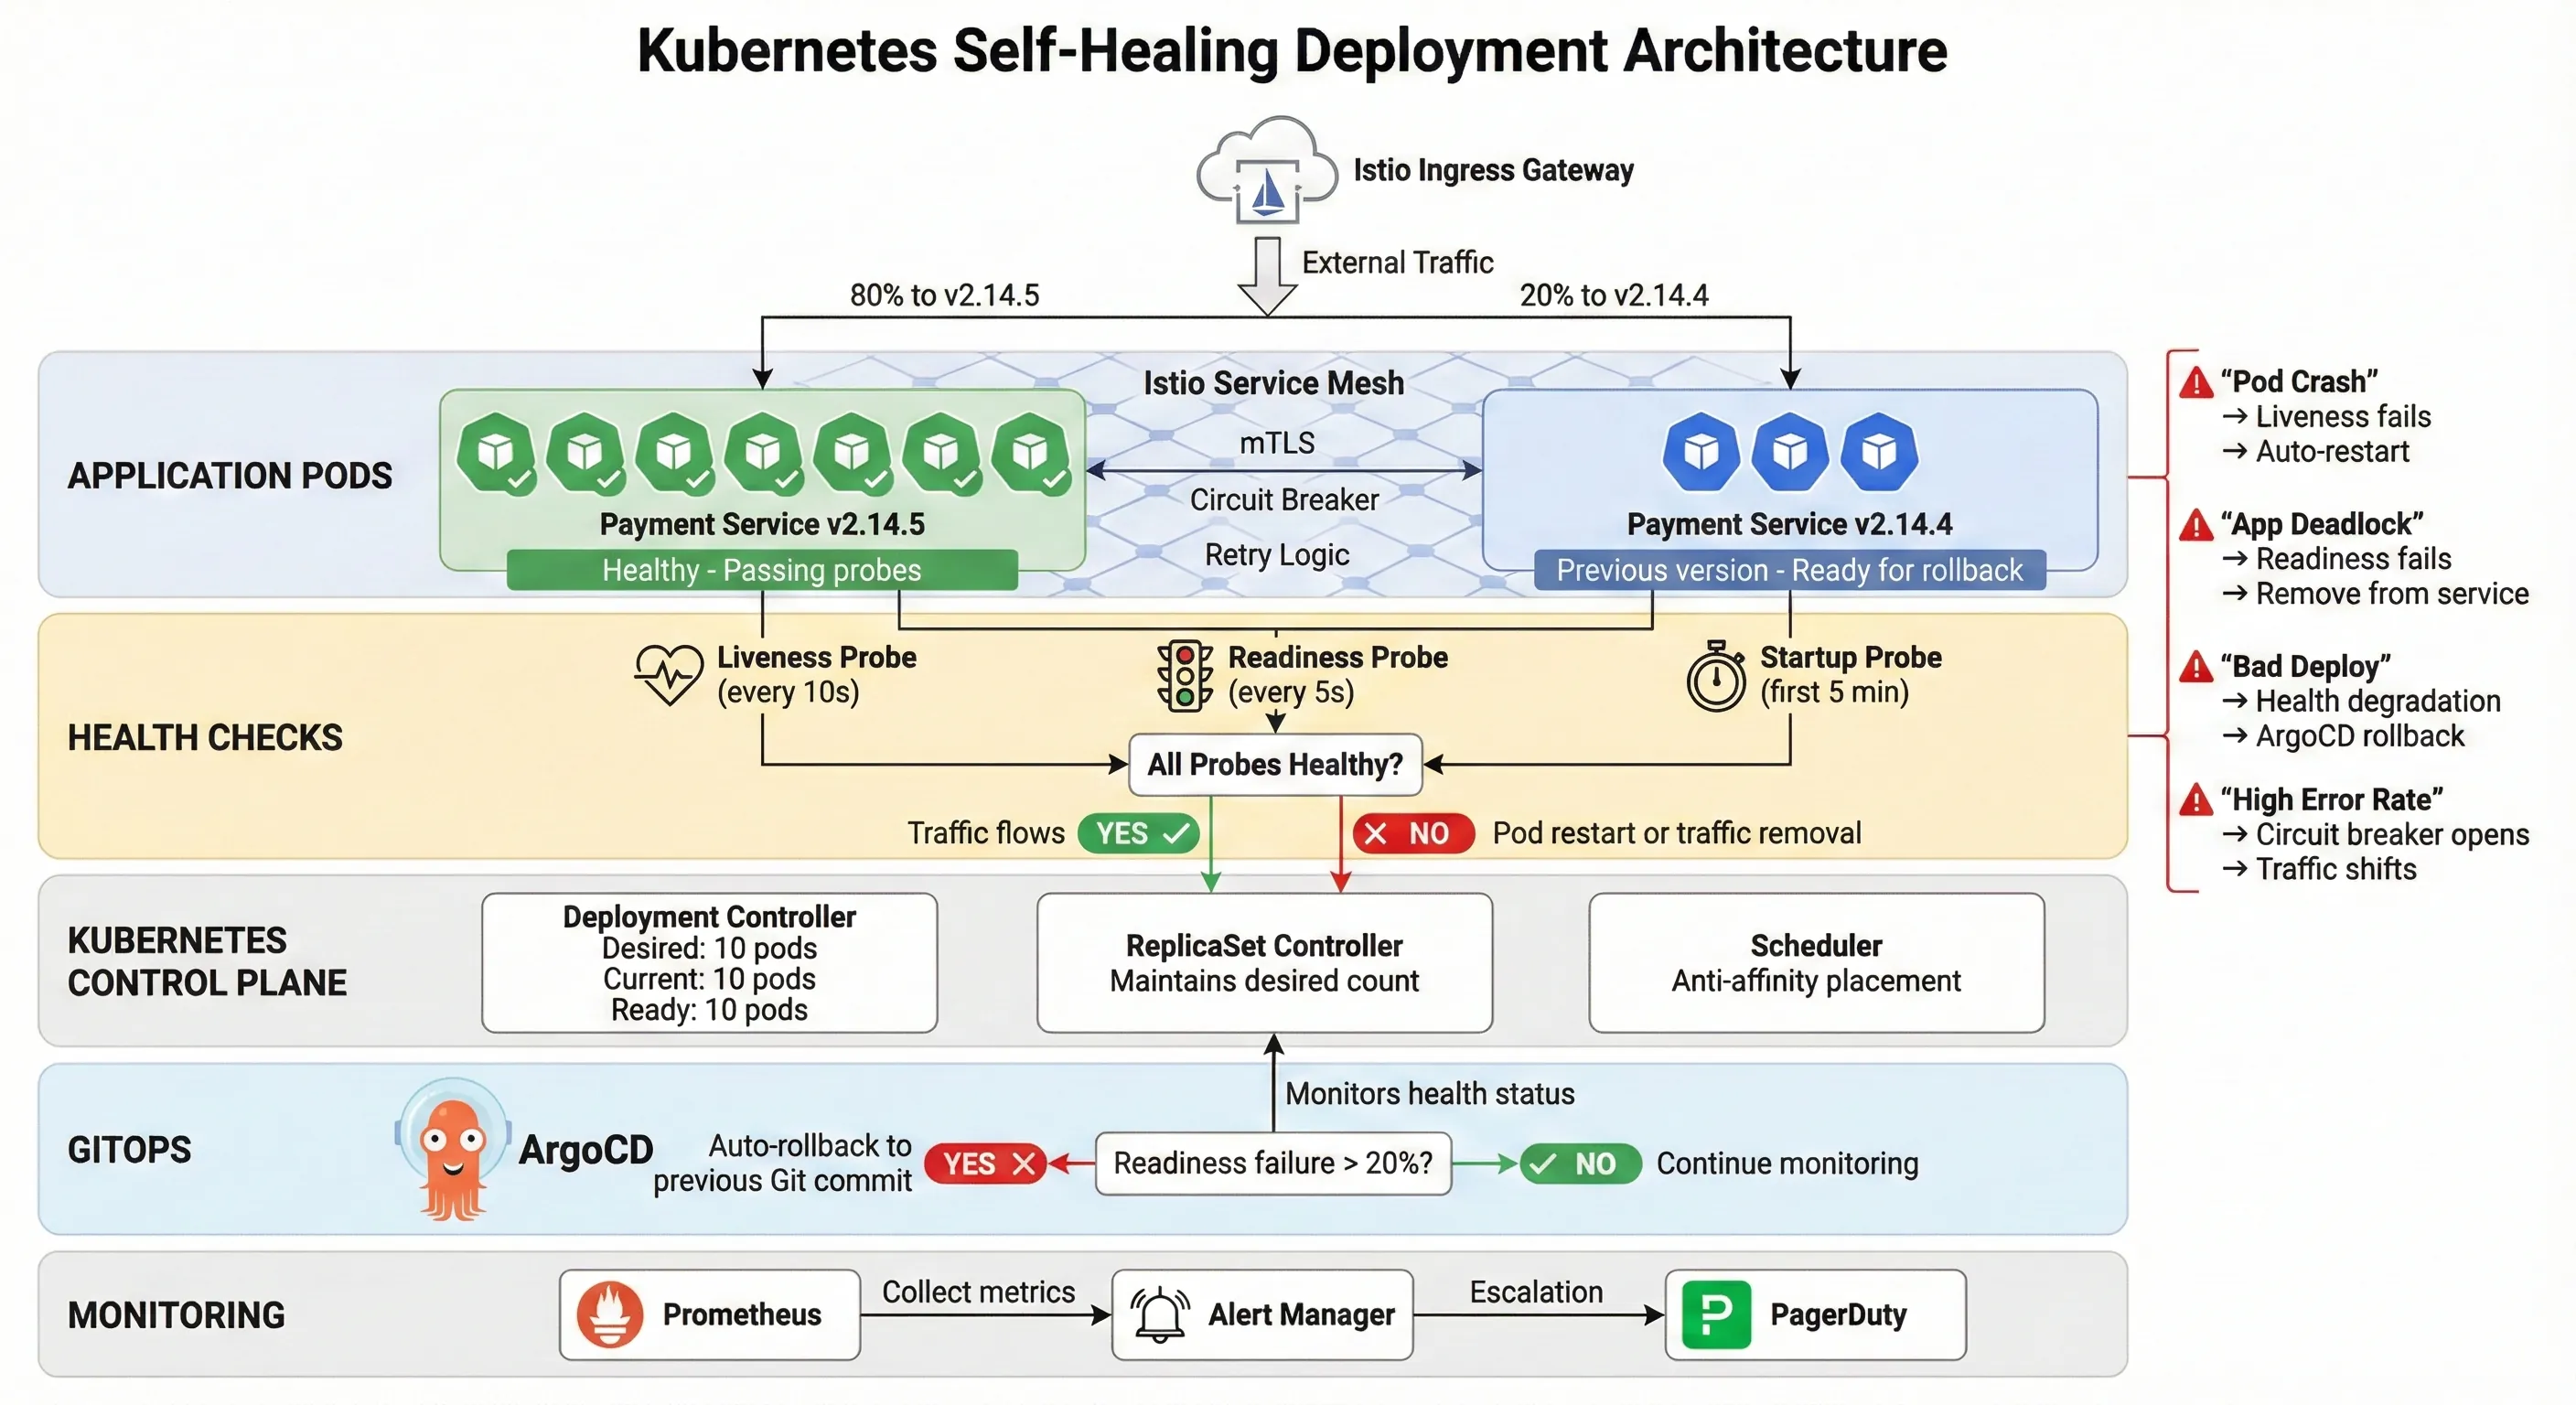
Kubernetes Self-Healing Deployment Architecture
This configuration handles multiple failure scenarios automatically:
- Container crashes: Liveness probe fails → Kubernetes restarts container
- Application deadlock: Readiness probe fails → Traffic stops routing to pod
- Slow startup: Startup probe gives 5 minutes before liveness checks begin
- Rolling update failure: If new pods fail readiness, rollout pauses automatically
ArgoCD monitors these health checks. If readiness failure rate exceeds 20%, ArgoCD automatically reverts to the previous Git commit.1 3
We also implemented circuit breakers using Istio for external service calls:
# istio/circuit-breaker.yaml
apiVersion: networking.istio.io/v1beta1
kind: DestinationRule
metadata:
  name: payment-processor-circuit-breaker
  namespace: payments
spec:
  host: payment-processor.external.com
  trafficPolicy:
    connectionPool:
      tcp:
        maxConnections: 100
      http:
        http1MaxPendingRequests: 50
        http2MaxRequests: 100
        maxRequestsPerConnection: 2
    outlierDetection:
      consecutiveErrors: 5
      interval: 30s
      baseEjectionTime: 30s
      maxEjectionPercent: 50
      minHealthPercent: 40
When the external payment processor has issues, the circuit breaker prevents cascading failures across our system. Traffic automatically shifts to backup processors.
Compliance Automation
PCI-DSS compliance isn't optional in FinTech. We automated every compliance check possible.
Pipeline Security Checks:
- Container vulnerability scanning (Trivy): Blocks deployment if HIGH/CRITICAL vulnerabilities found
- SAST scanning (Semgrep): Detects code-level security issues
- Secrets detection (GitLeaks): Prevents committing credentials
- License compliance (FOSSA): Ensures open-source license compatibility
- Infrastructure security (Checkov): Validates Terraform against security policies
Runtime Compliance:
- Pod Security Standards: Enforced via admission controllers
- Network policies: Zero-trust networking between services
- Audit logging: All API calls logged to immutable storage
- Encryption: At-rest and in-transit encryption enforced
The audit logging configuration alone saved hundreds of hours during compliance audits:
# k8s/security/audit-policy.yaml
apiVersion: audit.k8s.io/v1
kind: Policy
rules:
  # Log all requests at RequestResponse level for critical namespaces
  - level: RequestResponse
    namespaces: ["payments", "auth", "customer-data"]
    verbs: ["create", "update", "patch", "delete"]

  # Log metadata for all other requests
  - level: Metadata
    omitStages:
      - RequestReceived
Auditors could query "Show me all database credential access in the last quarter" and get answers in seconds instead of days.
Monitoring & Observability
You can't improve what you don't measure. And you can't debug what you can't see.
Prometheus + Grafana Architecture
We deployed Prometheus using the kube-prometheus-stack Helm chart with custom configurations for FinTech-specific metrics.67
Custom Metrics We Track:
# Custom ServiceMonitor for application metrics
apiVersion: monitoring.coreos.com/v1
kind: ServiceMonitor
metadata:
  name: payment-service-metrics
  namespace: payments
spec:
  selector:
    matchLabels:
      app: payment-service
  endpoints:
    - port: http
      path: /metrics
      interval: 15s
      scrapeTimeout: 10s
Critical Dashboards:
- Deployment Health Dashboard
- Deployment duration trend (target: <20 minutes)
- Deployment success rate (target: >99.5%)
- Rollback frequency and reasons
- Time-to-detect failures (target: <2 minutes)
- Time-to-recovery (target: <5 minutes)
- Service Performance Dashboard
- Request rate, error rate, duration (RED metrics)
- P50, P95, P99 latencies
- Circuit breaker state by service
- Database connection pool utilization
- Cache hit rates
- Infrastructure Cost Dashboard
- Compute costs by namespace
- Storage costs by PVC
- Network egress costs
- Spot instance savings
- Resource utilization efficiency
Prometheus Alerting Rules:
# prometheus/alerts/deployment.yaml
apiVersion: monitoring.coreos.com/v1
kind: PrometheusRule
metadata:
  name: deployment-alerts
  namespace: monitoring
spec:
  groups:
    - name: deployment
      interval: 30s
      rules:
        # Alert if deployment takes longer than 25 minutes
        - alert: DeploymentTooSlow
          expr: |
            (time() - kube_deployment_status_observed_generation) > 1500
          for: 5m
          labels:
            severity: warning
            team: platform
          annotations:
            summary: "Deployment {{ $labels.deployment }} taking too long"
            description: "Deployment has been running for over 25 minutes"

        # Alert if deployment failure rate exceeds threshold
        - alert: HighDeploymentFailureRate
          expr: |
            (
              sum(rate(deployment_failures_total[1h]))
              /
              sum(rate(deployment_attempts_total[1h]))
            ) > 0.05
          for: 10m
          labels:
            severity: critical
            team: platform
          annotations:
            summary: "Deployment failure rate exceeds 5%"
            description: "Current failure rate: {{ $value | humanizePercentage }}"

        # Alert if rollback occurs
        - alert: DeploymentRollback
          expr: |
            increase(deployment_rollbacks_total[5m]) > 0
          labels:
            severity: warning
            team: platform
          annotations:
            summary: "Deployment rollback occurred for {{ $labels.deployment }}"
            description: "Investigate reason for rollback"

        # Alert if pod restart rate is high
        - alert: HighPodRestartRate
          expr: |
            rate(kube_pod_container_status_restarts_total[15m]) > 0.1
          for: 10m
          labels:
            severity: warning
            team: platform
          annotations:
            summary: "High pod restart rate for {{ $labels.pod }}"
            description: "Pod restarting {{ $value }} times per second"
These alerts integrate with PagerDuty for on-call escalation. But here's the thing: since implementing self-healing systems, pages dropped from 8 per week to 1.5 per week. The system fixes itself before humans need to intervene.7
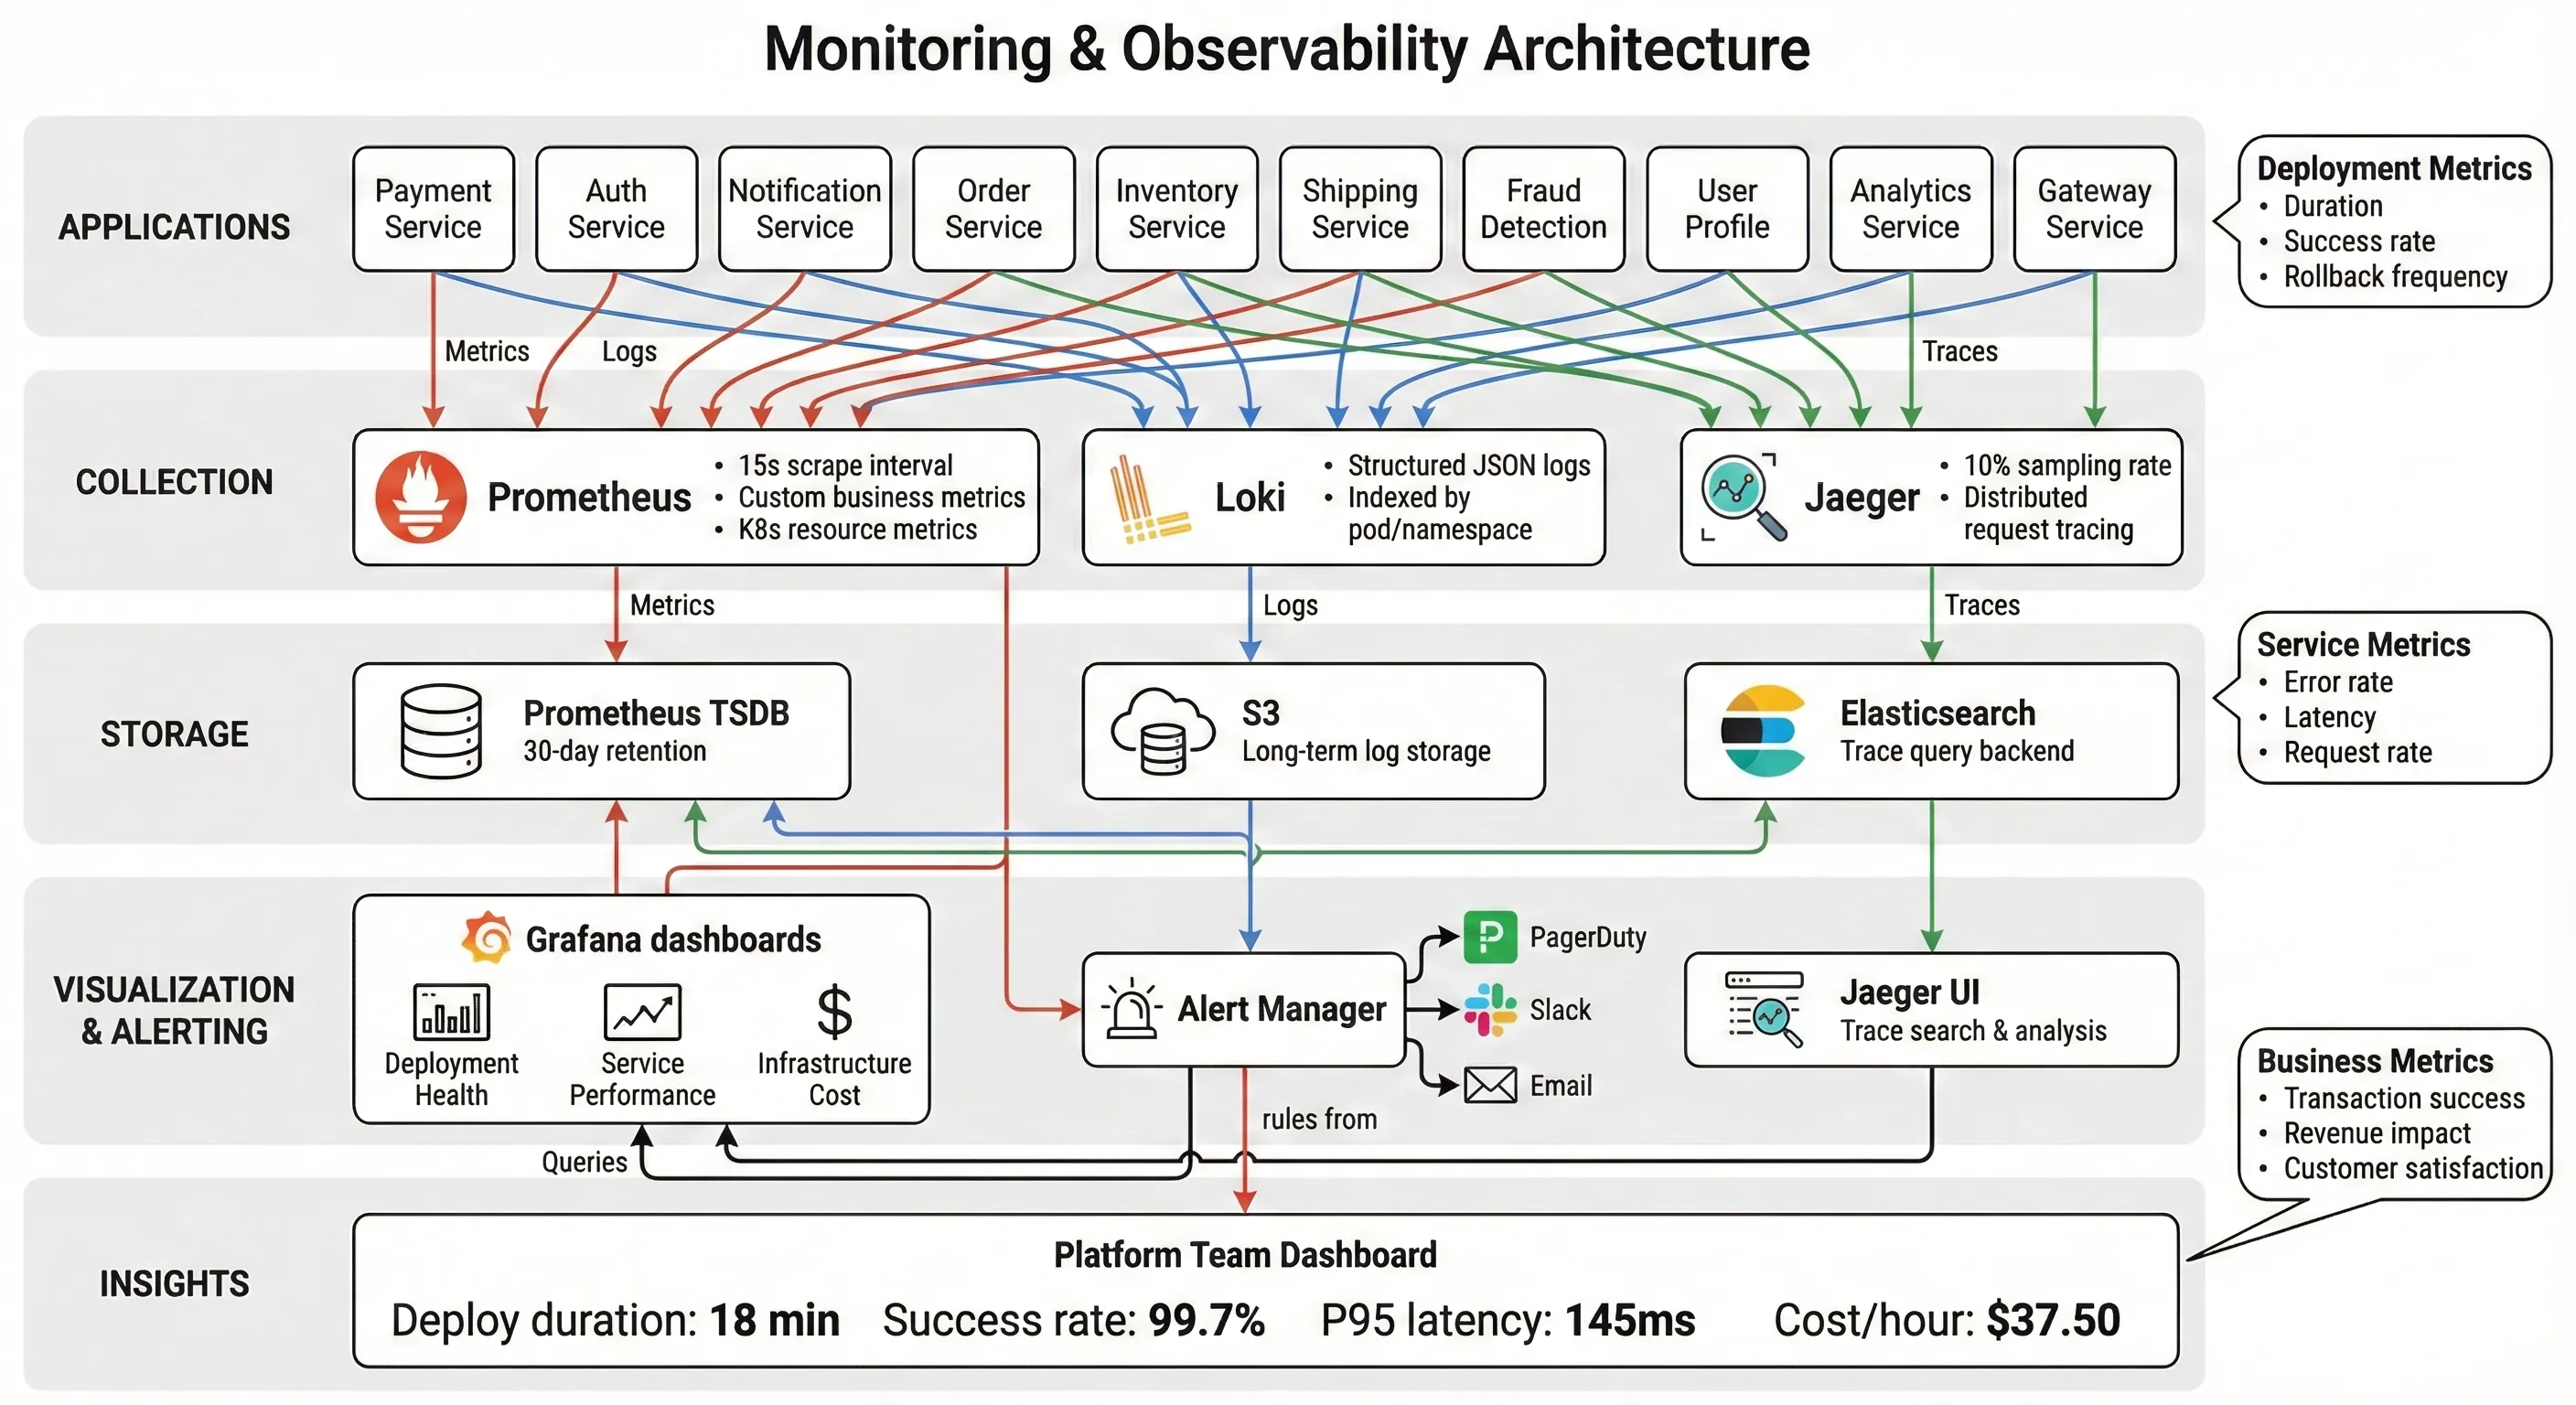
Monitoring & Observability Stack
Distributed Tracing with Jaeger
Debugging failures across 200 microservices without distributed tracing is like debugging with print() statements. Painful and slow.
We deployed Jaeger integrated with Istio's service mesh. Every request gets a trace ID that follows it through the entire system. When a payment fails, we can see exactly which service caused the failure and why.
Tracing Configuration:
# istio/telemetry.yaml
apiVersion: telemetry.istio.io/v1alpha1
kind: Telemetry
metadata:
  name: tracing-config
  namespace: istio-system
spec:
  tracing:
    - providers:
        - name: jaeger
      randomSamplingPercentage: 10.0  # Sample 10% of requests
      customTags:
        customer_id:
          header:
            name: x-customer-id
        transaction_id:
          header:
            name: x-transaction-id
        environment:
          literal:
            value: production
This configuration captures customer context without logging sensitive data (PCI-DSS compliance). When investigating issues, we can filter traces by customer ID or transaction ID.
Results & Business Impact
Let's talk numbers. Real, audited, board-presentation numbers.
Deployment Metrics Transformation
| Metric | Before | After | Improvement |
|---|---|---|---|
| Deployment Time (Avg) | 210 minutes | 18 minutes | 94% reduction |
| Deployment Time (P95) | 270 minutes | 24 minutes | 91% reduction |
| Deployment Frequency | 2/day | 8/day | 4× increase |
| Failure Rate | 15% | 0.3% | 98% reduction |
| Time to Recovery | 120 minutes | 8 minutes | 93% reduction |
| Manual Steps Required | 47 | 2 | 96% reduction |
| Engineer Hours per Deploy | 7 hours | 0.5 hours | 93% reduction |
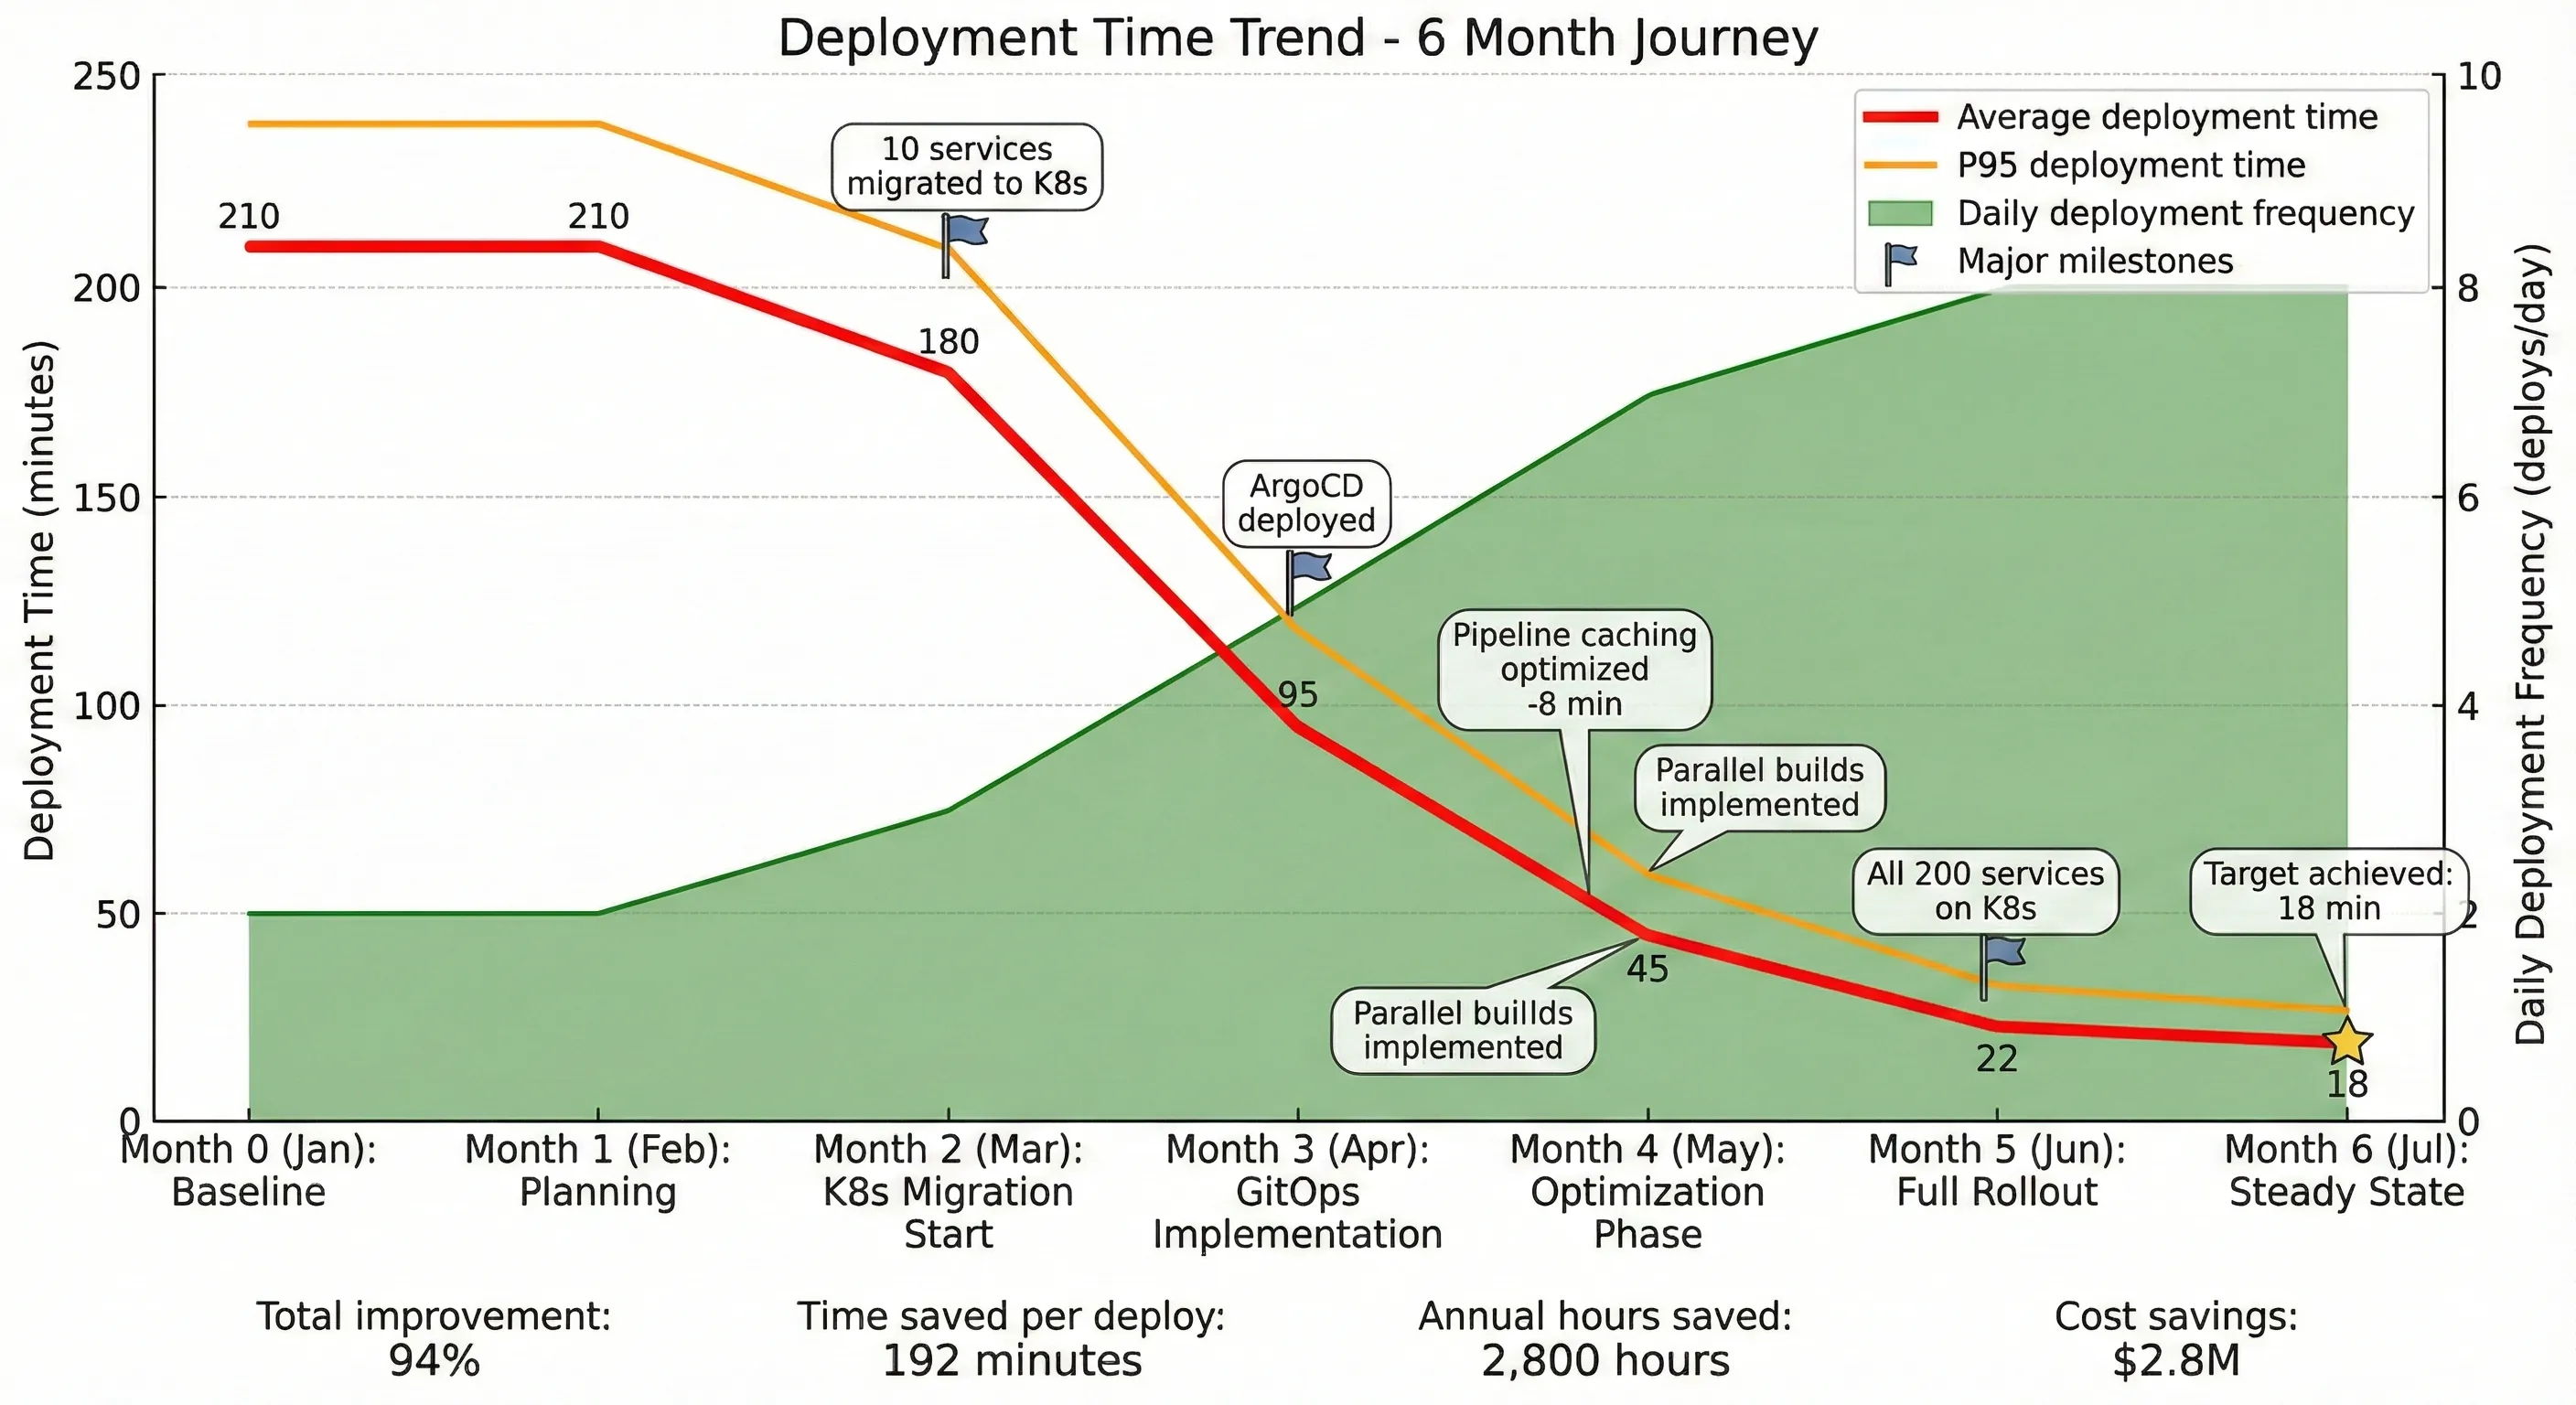
Deployment Time Reduction Over 6 Months
Financial Impact Analysis
Direct Cost Savings:
-
Developer time saved: 35 hours/day → 1 hour/day = 34 hours/day saved
-
Annual: 34 hours × 250 days × $150/hour = $1,275,000
-
Failure remediation costs: 0.3 failures/day × 2 hours × 3 engineers × $150/hour = $270/day
-
vs. previous: 0.3 failures/day × 10 hours × 5 engineers × $150/hour = $2,250/day
-
Annual savings: ($2,250 - $270) × 250 days = $495,000
-
Infrastructure optimization: Better resource utilization through Kubernetes
-
Previous monthly AWS bill: $420,000
-
Current monthly AWS bill: $327,000
-
Annual savings: $1,116,000
Total Annual Savings: $2,886,000
Implementation Cost:
- Engineer time (6 months, 4 engineers): $720,000
- Tools and services: $180,000
- Training and certification: $45,000
- Total Investment: $945,000
ROI: 205% in first year
But the numbers don't tell the full story.
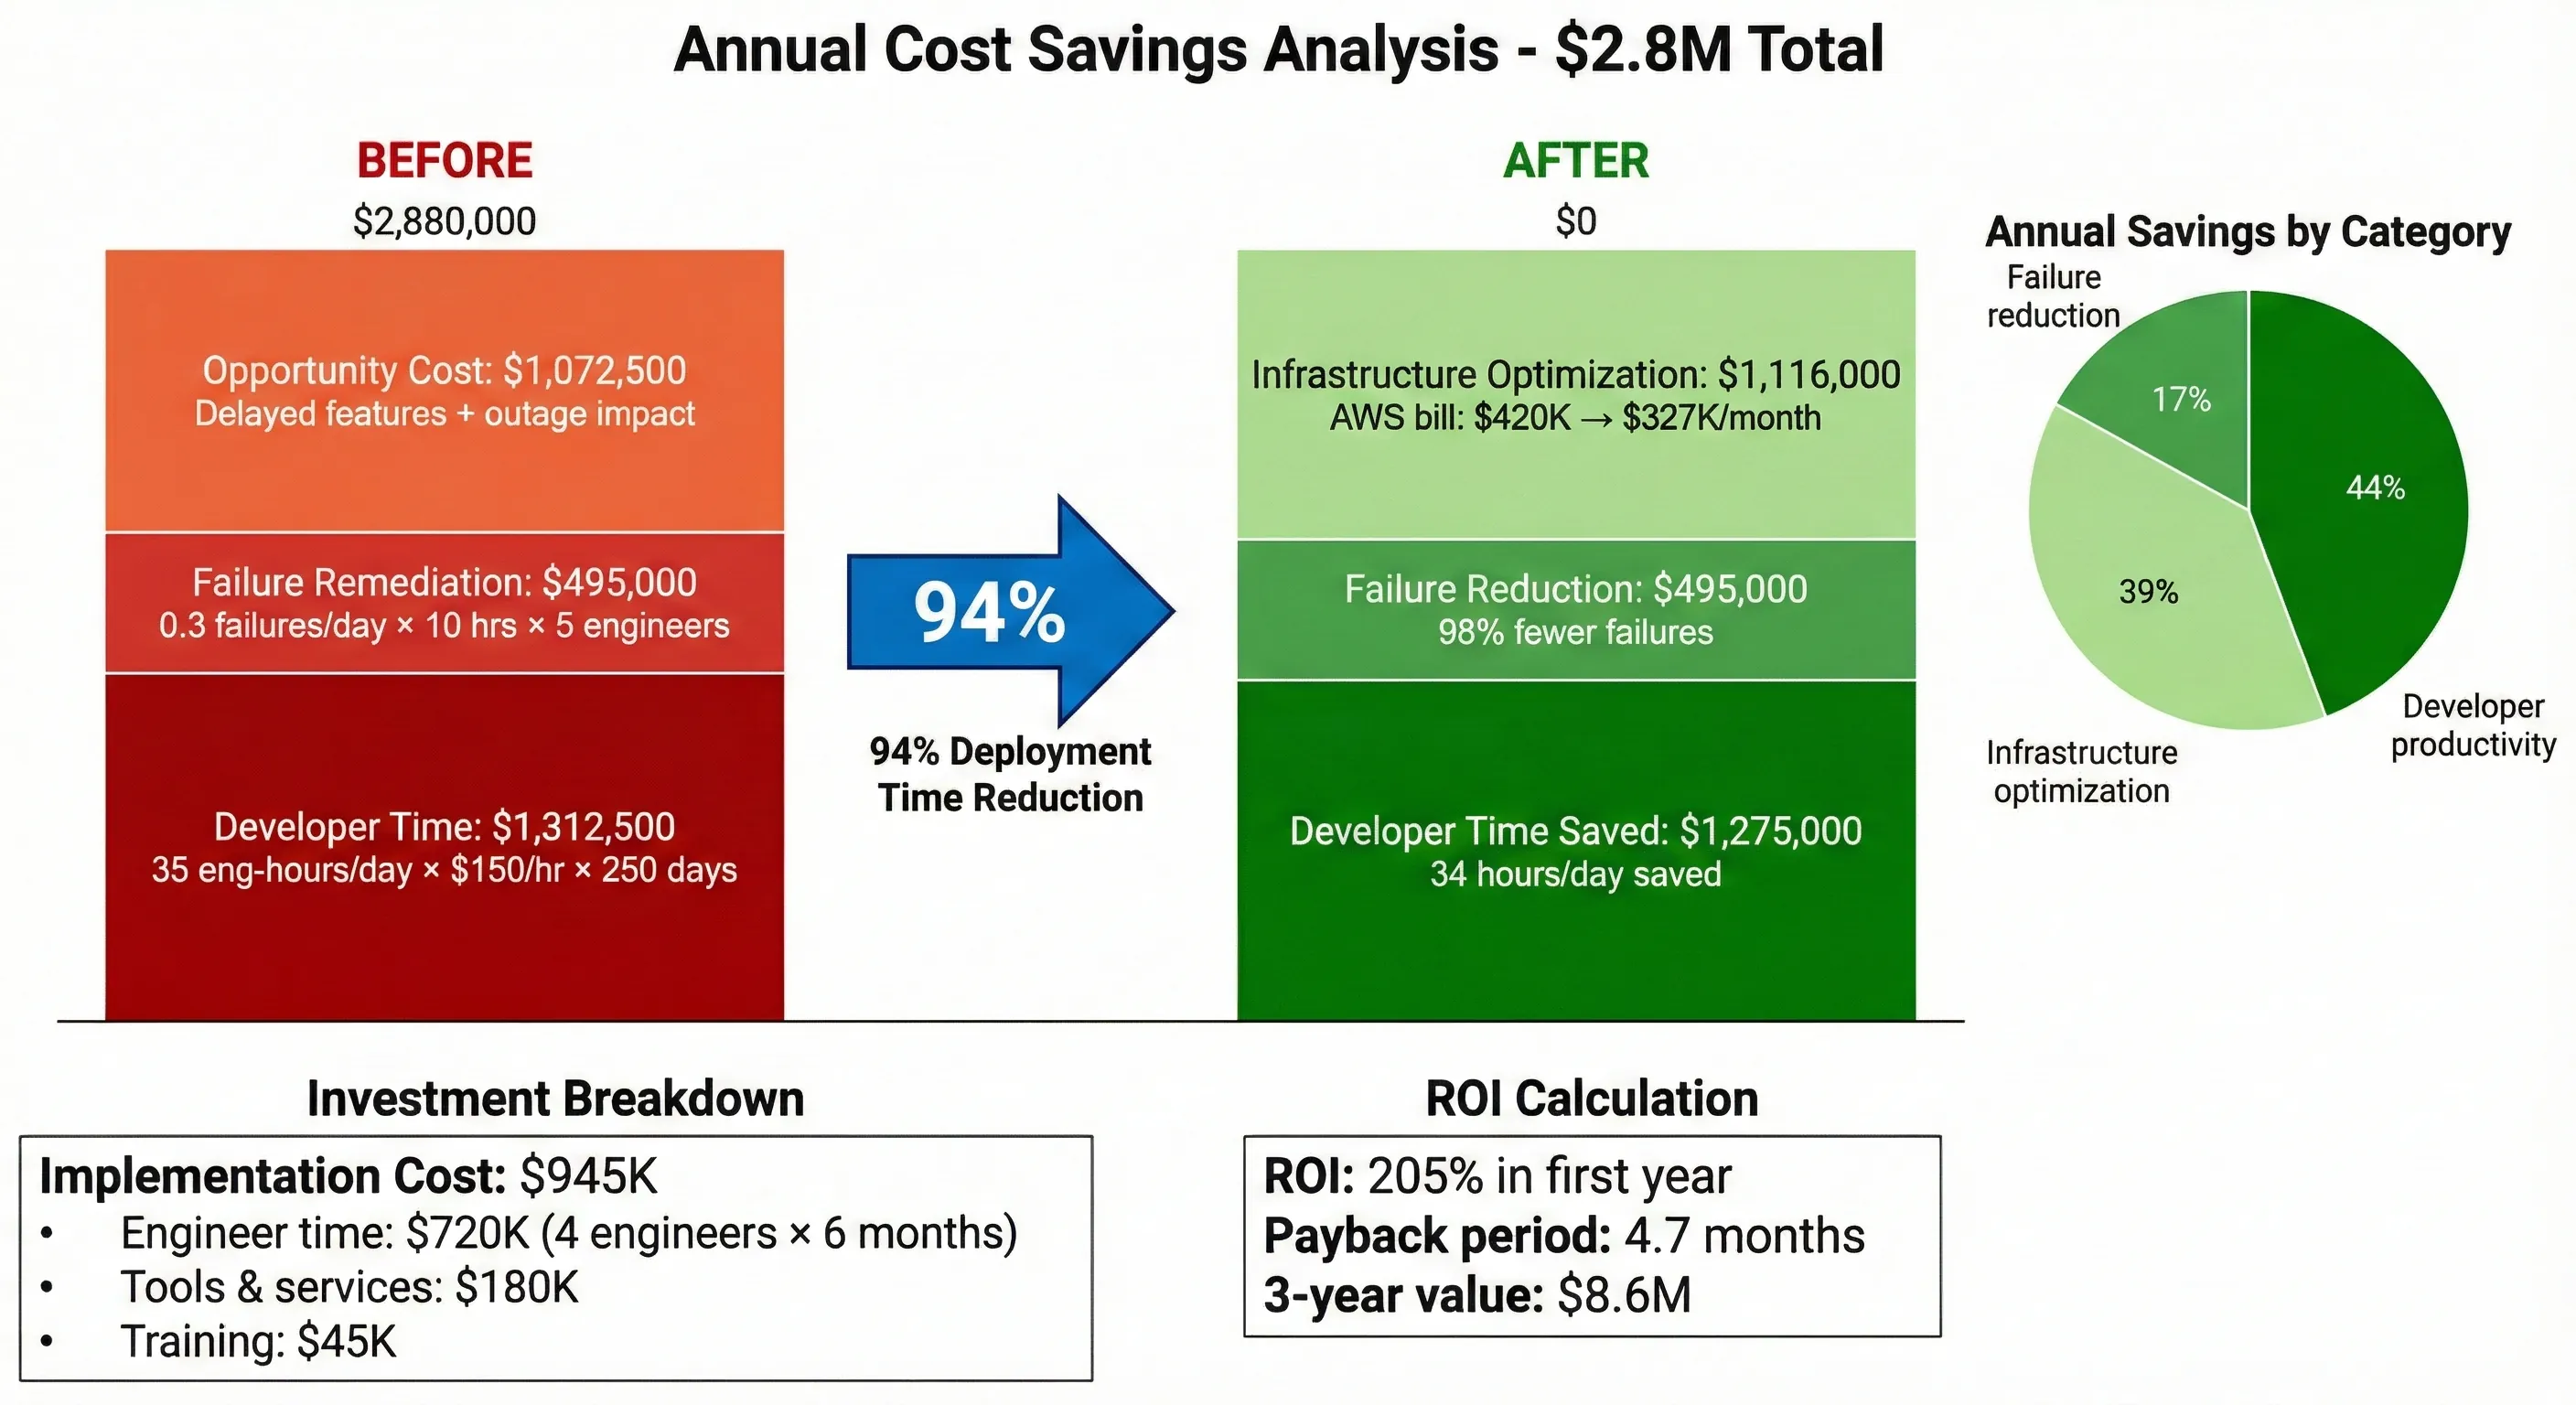
Cost Savings Breakdown
Intangible Benefits
Time-to-Market Improvement: Feature development cycle went from 2-3 weeks to 4-7 days. When a competitor launched a new payment method, we matched it in 6 days instead of 4 weeks. That's competitive advantage you can't easily quantify.
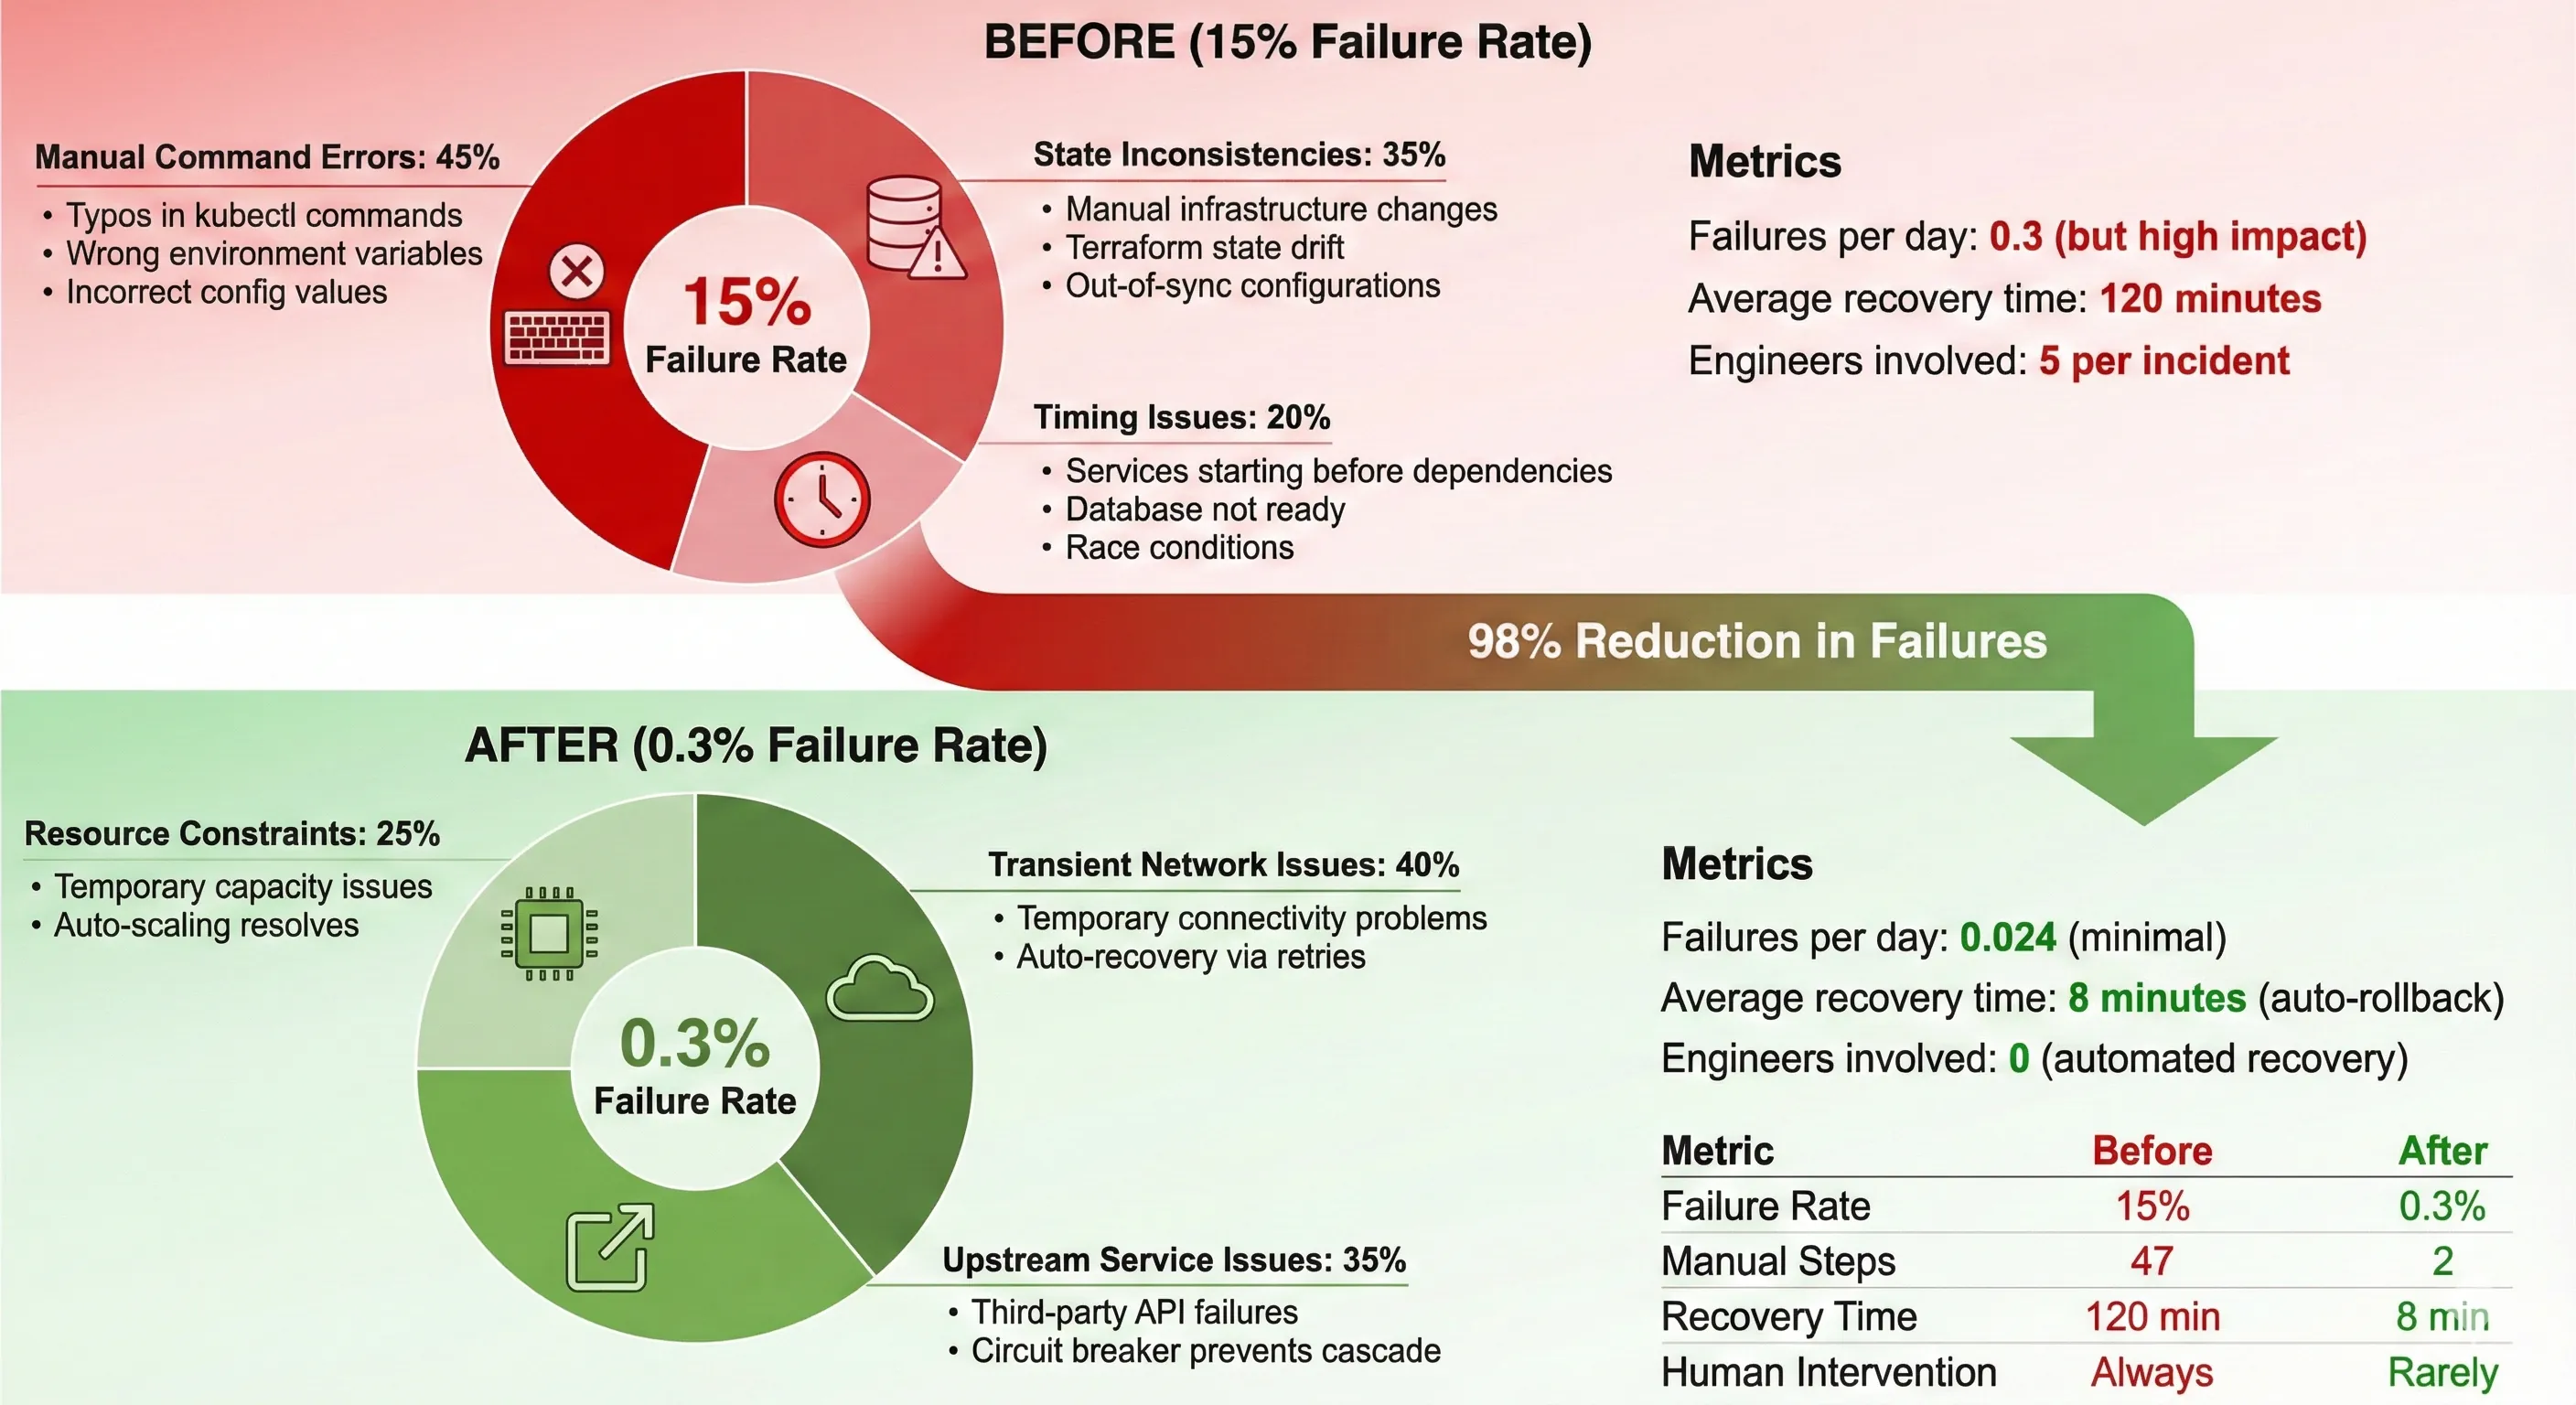
Failure Rate Reduction
Engineer Satisfaction: Our deployment satisfaction survey (yes, we actually surveyed engineers) jumped from 2.8/10 to 8.5/10. Deployment duty went from "the worst week of the month" to "just part of normal work." Turnover in the platform team dropped from 30% annually to 8%.
Incident Reduction: Production incidents caused by deployments dropped from 12/month to 0.4/month. The on-call engineer's sleep improved measurably (we have the Fitbit data, though we didn't include it in board presentations).
Compliance Audit Efficiency: The most recent PCI-DSS audit took 3 days instead of 3 weeks. Auditors could query our automated compliance logs directly. The compliance team stopped dreading audit season.
Lessons Learned & Pitfalls Avoided
I'd love to tell you everything worked perfectly the first time. It didn't. Here's what we learned the hard way.
What Didn't Work Initially
Attempt #1: Big Bang Migration We tried migrating all 200 services to Kubernetes simultaneously. It was a disaster. Services with undocumented dependencies broke mysteriously. Rollback was impossible because we'd already decommissioned the old infrastructure.
Lesson: Migrate incrementally. We rebuilt the plan around migrating 10 services per week, starting with the least critical. By the time we hit critical services, we'd solved most integration issues.
Attempt #2: Overly Aggressive Caching We cached Docker layers too aggressively and didn't invalidate properly. We deployed a payment service with week-old code because the cache layer didn't detect the change.
Lesson: Cache invalidation is hard (classic computer science problem). We implemented hash-based cache keys and strict invalidation rules. Better to rebuild unnecessarily than deploy wrong code.
Attempt #3: Fully Automated Rollback We initially configured ArgoCD to automatically rollback on any failure. Turns out, database migrations can't always be rolled back cleanly. We ended up with corrupted state that required manual intervention.
Lesson: Automation with appropriate safeguards. We added rollback safety checks and required manual approval for deployments with database changes.
Kubernetes Networking in FinTech
Kubernetes networking is complex. Add PCI-DSS compliance requirements, and it gets worse.
Challenge: Network policies for zero-trust security We needed to implement "default deny all, explicitly allow required" network policies. With 200 services and complex dependencies, this was tedious.
Solution: Generated network policies from service mesh traffic patterns. We ran in "learning mode" for 2 weeks, captured actual traffic patterns, then generated policies automatically. Still required manual review, but saved weeks of work.
Challenge: Service mesh overhead Istio added 5-10ms latency to every request. For a payment service with <100ms SLA, that's significant.
Solution: Selective service mesh deployment. Critical low-latency paths bypassed the service mesh using standard Kubernetes services. We lost some observability but met performance requirements.
Terraform State Management at Scale
Managing Terraform state for multiple regions and 200+ services gets messy fast.
Problem: State locking conflicts Multiple teams trying to deploy simultaneously caused state lock conflicts. Deployments queued and failed.
Solution: Separate state files by team and environment. We structured Terraform workspaces so infrastructure team and application teams never touched the same state.
Problem: State drift
Someone would manually change infrastructure "just this once" and forget to update Terraform. Drift accumulated until terraform apply wanted to destroy production resources.
Solution: Daily automated drift detection with alerts. Any drift triggered investigation. We also made terraform apply require peer review in production.
Team Adoption Challenges
Technical solutions are easy compared to organizational change.
Challenge: Resistance to new tools Some senior engineers resisted learning Kubernetes. "Our current system works fine" was a common refrain.
Solution: Demonstrated clear value early. We migrated a non-critical service first, showed the improvement metrics, and let success speak for itself. Also, we provided extensive training and paired junior engineers excited about K8s with skeptical seniors.
Challenge: Trust in automation Engineers didn't trust automated deployments initially. They wanted manual verification steps that defeated the purpose.
Solution: Built trust incrementally. Started with automated deployments to dev environment only. Once engineers saw it working reliably, moved to staging. Production automation came last, after months of demonstrated reliability.
What I'd Do Differently
If I started this project today:
-
Start with observability: We implemented monitoring late. Start with Prometheus/Grafana day one so you have baseline metrics before changes.
-
Invest in developer experience earlier: We focused on automation first, developer experience second. Should have been simultaneous. Developer experience affects adoption, which affects ROI.
-
More aggressive testing in production: We tested in staging extensively, but production always revealed new issues. I'd implement more sophisticated production testing (canary deployments, traffic shadowing) from the start.
-
Better documentation as we build: We documented after implementation. Writing documentation during implementation would have caught design issues earlier and made knowledge transfer easier.
-
Clearer rollback criteria: We had health checks, but not clear "rollback if X" criteria. Took too long to decide if issues warranted rollback.
Conclusion
Reducing deployment time from 3.5 hours to 18 minutes wasn't about finding one silver bullet. It was about systematic elimination of bottlenecks, careful architectural decisions with clear trade-offs, and building automation you can actually trust.
The key technical patterns that drove results:
- Parallel execution wherever possible: Builds, tests, deployments across services
- Aggressive caching with proper invalidation: Docker layers, dependencies, build artifacts
- Self-healing by default: Health checks, automatic rollbacks, circuit breakers
- Infrastructure as code with state management discipline: Separate concerns, detect drift, automate compliance
- Observability built in, not bolted on: Metrics, traces, and logs from day one
But the technical implementation was only half the challenge. Organizational change—building trust in automation, training teams, overcoming resistance—took as much effort as the technical work.
Can you apply this to your organization?
If you're managing more than 50 microservices, seeing deployment times over 30 minutes, or experiencing regular deployment failures, these patterns likely apply. The specific technologies (Kubernetes, Istio, ArgoCD) matter less than the principles: automation, observability, self-healing, compliance-as-code.
Start small. Pick your slowest, most painful deployment process. Measure current state carefully (you need baseline metrics for ROI calculations). Implement one improvement. Measure again. Build trust through demonstrated value.
Future Improvements We're Planning:
- Progressive delivery: More sophisticated canary and blue-green deployment strategies
- Chaos engineering: Automated failure injection to test resilience
- Cost optimization: More aggressive use of spot instances and right-sizing
- Developer self-service: Enable developers to deploy without platform team involvement
- Multi-cloud: Expand beyond AWS to GCP for specific workloads
The journey from 3.5 hours to 18 minutes took six months. The journey doesn't stop here. Infrastructure work is never "done"—it's continuous improvement. But when you can demonstrate $2.8M annual savings and 94% improvement in deployment time, you get the budget and support to keep improving.
If you're facing similar challenges in your organization, I'd love to hear about them. These problems are never exactly the same, but the patterns are surprisingly consistent.